## Line Graph: Success Rate vs Problem Size
### Overview
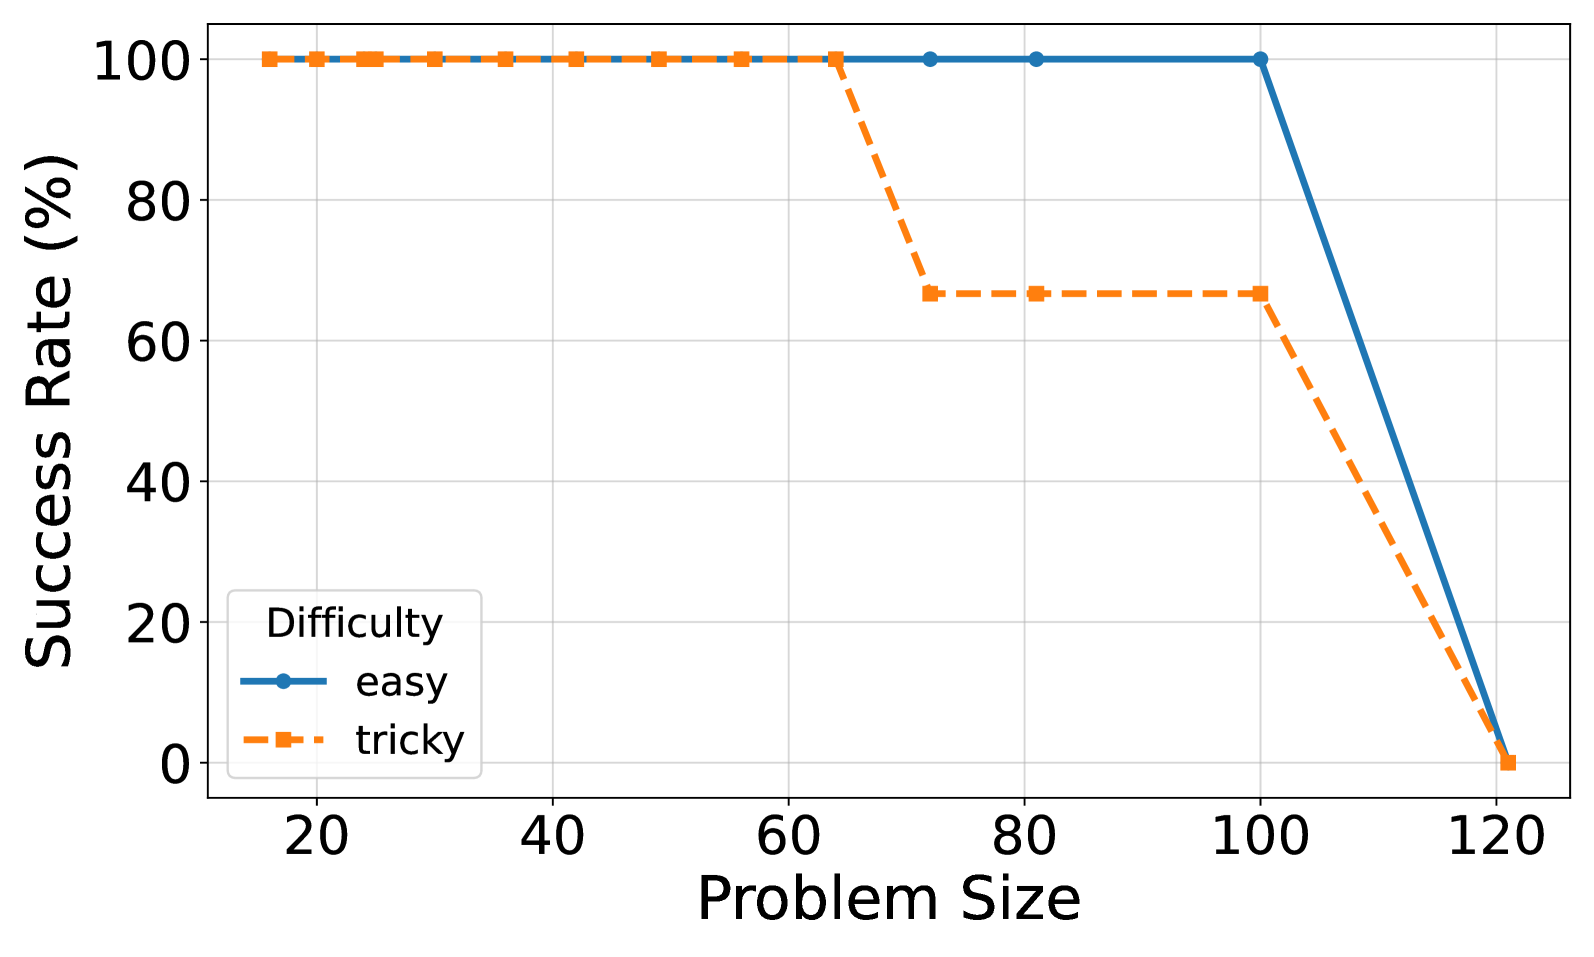
The image depicts a line graph comparing success rates for two difficulty levels ("easy" and "tricky") across varying problem sizes (20–120). The graph shows two distinct trends: one for easy problems (solid blue line) and one for tricky problems (dashed orange line).
### Components/Axes
- **X-axis (Problem Size)**: Labeled "Problem Size" with markers at 20, 40, 60, 80, 100, and 120.
- **Y-axis (Success Rate %)**: Labeled "Success Rate (%)" with markers at 0, 20, 40, 60, 80, and 100.
- **Legend**: Located in the bottom-left corner, with:
- Solid blue line: "easy"
- Dashed orange line: "tricky"
### Detailed Analysis
1. **Easy (Blue Line)**:
- Maintains 100% success rate for problem sizes 20–100.
- Drops sharply from 100% to 0% between problem sizes 100 and 120.
- Key data points:
- 20: 100%
- 40: 100%
- 60: 100%
- 80: 100%
- 100: 100%
- 120: 0%
2. **Tricky (Orange Line)**:
- Maintains 100% success rate for problem sizes 20–60.
- Drops to ~65% at problem size 80, remains flat until 100.
- Drops sharply to 0% between problem sizes 100 and 120.
- Key data points:
- 20: 100%
- 40: 100%
- 60: 100%
- 80: ~65%
- 100: ~65%
- 120: 0%
### Key Observations
- **Threshold Behavior**: Both difficulty levels maintain perfect success until a critical problem size (100 for "easy," 60 for "tricky"), after which performance collapses.
- **Catastrophic Failure**: Both lines exhibit abrupt drops to 0% at the maximum problem size (120), suggesting a binary success/failure outcome.
- **Divergence at Mid-Sizes**: The "tricky" line shows a significant drop (~35%) at problem size 80, while the "easy" line remains stable.
### Interpretation
The graph demonstrates that:
1. **Problem Size Thresholds**: There exists a critical problem size beyond which success rates collapse entirely, regardless of difficulty. For "easy" problems, this occurs at size 100; for "tricky" problems, it occurs earlier at size 60.
2. **Difficulty Impact**: While "easy" problems maintain perfect performance up to size 100, "tricky" problems begin failing at half that size (60), though not catastrophically until size 100.
3. **Binary Outcomes**: The abrupt drops to 0% suggest a system with no partial success—problems are either fully solved or completely failed, with no intermediate states.
This pattern could reflect a system where:
- Problem complexity increases non-linearly with size
- Users/algorithms have a "breaking point" beyond which performance degrades rapidly
- Difficulty scaling introduces compounding errors that become insurmountable at certain thresholds