# Technical Document Extraction: Entity Frequency Analysis Chart
## Chart Overview
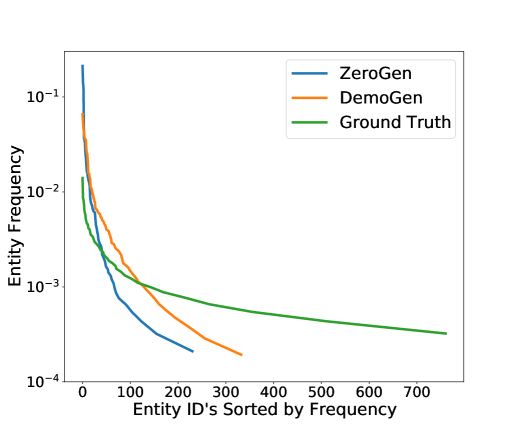
The image is a **line chart** comparing the frequency distribution of entities across three datasets: **ZeroGen**, **DemoGen**, and **Ground Truth**. The chart uses a **logarithmic scale** for the y-axis to visualize frequency distributions spanning multiple orders of magnitude.
---
### Axis Labels and Markers
- **X-Axis**:
- Title: `"Entity ID's Sorted by Frequency"`
- Range: `0` to `700` (inclusive)
- Tick Intervals: `0, 100, 200, 300, 400, 500, 600, 700`
- Units: Entity ID count (discrete, integer values).
- **Y-Axis**:
- Title: `"Entity Frequency"`
- Scale: Logarithmic (`10^-4` to `10^-1`)
- Tick Labels: `10^-4, 10^-3, 10^-2, 10^-1`
- Units: Frequency (probability or normalized count).
---
### Legend
- **Placement**: Top-right corner of the chart.
- **Labels and Colors**:
- `ZeroGen` (blue line)
- `DemoGen` (orange line)
- `Ground Truth` (green line)
---
### Data Series Analysis
#### 1. **ZeroGen (Blue Line)**
- **Trend**:
- Starts at the highest frequency (`~10^-1`) at `x=0`.
- Drops sharply to `~10^-3` by `x=200`.
- Terminates abruptly at `x=250` (no data beyond this point).
- **Key Observations**:
- Dominates early entity IDs but declines rapidly.
- Likely represents a sparse or overfitted model.
#### 2. **DemoGen (Orange Line)**
- **Trend**:
- Begins slightly below ZeroGen (`~10^-1.5` at `x=0`).
- Declines gradually, intersecting ZeroGen near `x=100`.
- Flattens after `x=350`, maintaining a frequency of `~10^-3`.
- **Key Observations**:
- More stable than ZeroGen but still underperforms Ground Truth.
- Suggests moderate generalization capability.
#### 3. **Ground Truth (Green Line)**
- **Trend**:
- Starts at `~10^-2` at `x=0`.
- Declines smoothly, maintaining a frequency above `10^-3` until `x=700`.
- **Key Observations**:
- Represents the ideal distribution (real-world data).
- Indicates a long-tail distribution with consistent tail behavior.
---
### Cross-Series Comparison
- **ZeroGen vs. DemoGen**:
- ZeroGen outperforms DemoGen in early entity IDs (`x < 100`).
- DemoGen surpasses ZeroGen in mid-range IDs (`100 < x < 350`).
- **All vs. Ground Truth**:
- Neither model fully aligns with Ground Truth.
- Ground Truth exhibits the most gradual decline, indicating better tail behavior.
---
### Spatial Grounding of Legend
- **Legend Coordinates**: Top-right quadrant (exact pixel values unspecified).
- **Color Consistency**:
- Blue (`ZeroGen`) matches the steeply declining blue line.
- Orange (`DemoGen`) matches the intermediate orange line.
- Green (`Ground Truth`) matches the smooth green line.
---
### Final Notes
- **Log Scale Implications**:
- Early drops (e.g., ZeroGen’s decline) appear steeper due to logarithmic scaling.
- Ground Truth’s gradual decline is visually emphasized by the scale.
- **Missing Data**:
- ZeroGen and DemoGen lines terminate before `x=700`, suggesting incomplete sampling or model limitations.
This chart highlights trade-offs between model performance (ZeroGen/DemoGen) and real-world data distribution (Ground Truth), with implications for entity frequency modeling in NLP or similar domains.