\n
## Scatter Plot: Projection of Activations on τ<sub>G</sub> and τ<sub>P</sub>
### Overview
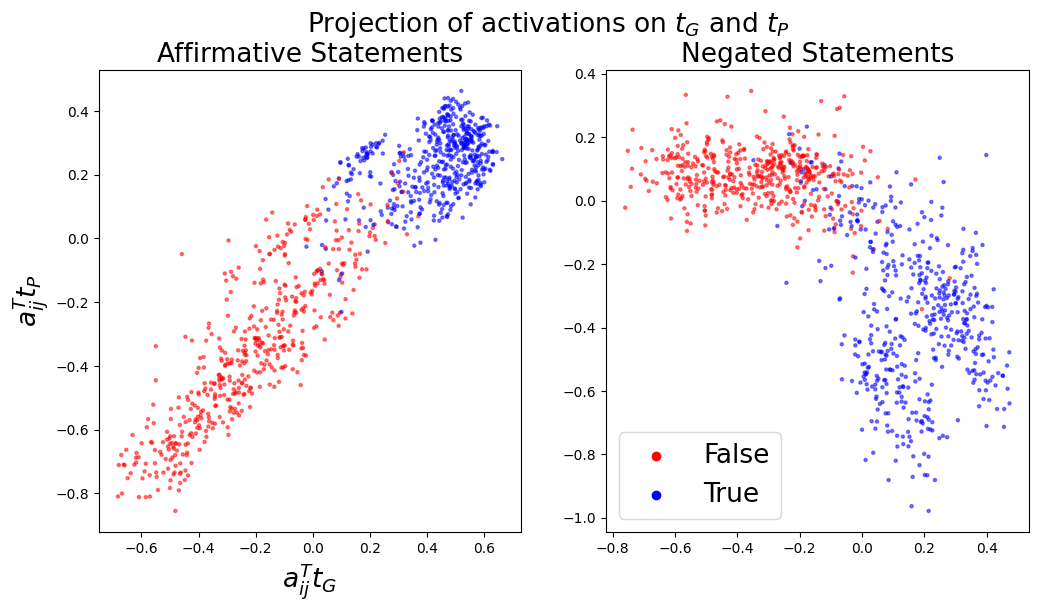
The image presents two scatter plots, side-by-side, visualizing the projection of activations onto two time constants, τ<sub>G</sub> and τ<sub>P</sub>. The left plot displays data for "Affirmative Statements," while the right plot shows data for "Negated Statements." Each point in the scatter plots represents a data point, colored to indicate whether the statement is "True" or "False."
### Components/Axes
* **Title:** "Projection of activations on τ<sub>G</sub> and τ<sub>P</sub>" (centered at the top)
* **Subtitles:** "Affirmative Statements" (left plot), "Negated Statements" (right plot)
* **X-axis Label (both plots):** a<sub>ij</sub>τ<sub>G</sub> (ranging approximately from -0.8 to 0.6)
* **Y-axis Label (both plots):** a<sub>ij</sub>τ<sub>P</sub> (ranging approximately from -0.8 to 0.4)
* **Legend (bottom-right):**
* Red circles: "False"
* Blue circles: "True"
### Detailed Analysis or Content Details
**Left Plot: Affirmative Statements**
* **Trend:** The data points form a roughly diagonal band. The points generally slope upwards from the bottom-left to the top-right.
* **False (Red):** Points are concentrated in the bottom-left quadrant, with a<sub>ij</sub>τ<sub>G</sub> ranging from approximately -0.6 to 0.0 and a<sub>ij</sub>τ<sub>P</sub> ranging from approximately -0.6 to 0.1.
* **True (Blue):** Points are concentrated in the top-right quadrant, with a<sub>ij</sub>τ<sub>G</sub> ranging from approximately 0.0 to 0.6 and a<sub>ij</sub>τ<sub>P</sub> ranging from approximately 0.0 to 0.4. There is some overlap with the red points.
**Right Plot: Negated Statements**
* **Trend:** The data points also form a roughly diagonal band, but it is less distinct than in the left plot. The points generally slope upwards from the bottom-left to the top-right.
* **False (Red):** Points are scattered across the plot, with a<sub>ij</sub>τ<sub>G</sub> ranging from approximately -0.8 to 0.4 and a<sub>ij</sub>τ<sub>P</sub> ranging from approximately -0.8 to 0.3.
* **True (Blue):** Points are also scattered, but tend to be more concentrated in the top-right quadrant, with a<sub>ij</sub>τ<sub>G</sub> ranging from approximately -0.4 to 0.4 and a<sub>ij</sub>τ<sub>P</sub> ranging from approximately -0.2 to 0.4. There is significant overlap with the red points.
### Key Observations
* The separation between "True" and "False" statements is much clearer for affirmative statements than for negated statements.
* The distribution of negated statements is more dispersed, suggesting that the projection onto τ<sub>G</sub> and τ<sub>P</sub> is less effective at distinguishing between true and false negated statements.
* There is some overlap between the "True" and "False" classes in both plots, indicating that the projection is not a perfect discriminator.
### Interpretation
The plots demonstrate how activations related to statements can be projected onto two time constants, τ<sub>G</sub> and τ<sub>P</sub>, to differentiate between true and false statements. The clearer separation observed in the "Affirmative Statements" plot suggests that the time constants are more effective at capturing the underlying dynamics of affirmative statements. The more dispersed distribution in the "Negated Statements" plot indicates that negation introduces complexity that is not fully captured by these time constants.
The overlap between the classes suggests that the projection is not a perfect representation of truthfulness and that other factors may influence the activations. This could be due to the inherent ambiguity of language or the limitations of the model used to generate the activations.
The choice of τ<sub>G</sub> and τ<sub>P</sub> as projection axes implies these time constants are relevant to the processing of statements and their truth values. Further investigation into the meaning of these time constants could provide insights into the neural mechanisms underlying truth evaluation. The fact that the separation is less clear for negated statements suggests that negation may involve different neural processes or require additional time constants to be accurately represented.