## Scatter Plot: Projection of Activations on t_G and t_P
### Overview
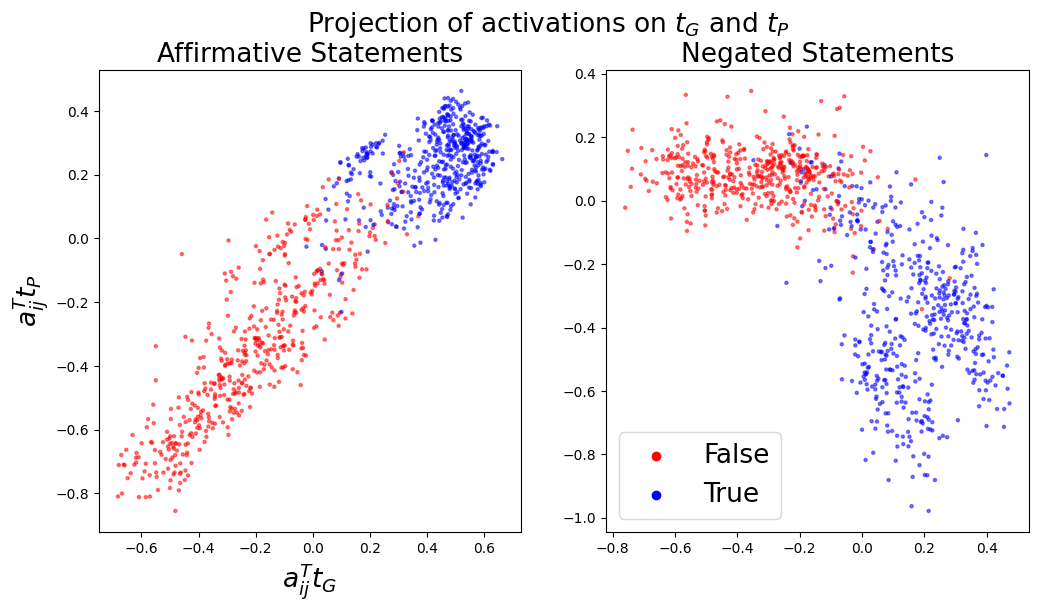
The image displays two side-by-side scatter plots under the main title "Projection of activations on t_G and t_P". The plots visualize the relationship between two projection values, `a_ij^T t_G` (x-axis) and `a_ij^T t_P` (y-axis), for two different conditions: "Affirmative Statements" (left plot) and "Negated Statements" (right plot). Data points are colored based on a binary label: "False" (red) or "True" (blue).
### Components/Axes
* **Main Title:** "Projection of activations on t_G and t_P" (centered at the top).
* **Subplot Titles:**
* Left Plot: "Affirmative Statements" (centered above the left chart).
* Right Plot: "Negated Statements" (centered above the right chart).
* **Axes Labels (Identical for both plots):**
* X-axis: `a_ij^T t_G` (centered below the x-axis).
* Y-axis: `a_ij^T t_P` (rotated 90 degrees, centered to the left of the y-axis).
* **Axes Scales (Approximate):**
* X-axis Range (both plots): -0.8 to 0.6.
* Y-axis Range (both plots): -1.0 to 0.4.
* **Legend:** Located in the bottom-right corner of the *right* subplot ("Negated Statements").
* Red circle: "False"
* Blue circle: "True"
### Detailed Analysis
**Left Plot: Affirmative Statements**
* **Trend Verification:** Both data series show a clear positive correlation. The cloud of points slopes upward from the bottom-left to the top-right.
* **Data Distribution:**
* **"False" (Red):** Points are densely clustered in the lower-left quadrant. Approximate centroid: x ≈ -0.3, y ≈ -0.4. The cluster extends roughly from x = -0.7 to 0.1 and y = -0.8 to 0.0.
* **"True" (Blue):** Points are densely clustered in the upper-right quadrant. Approximate centroid: x ≈ 0.4, y ≈ 0.3. The cluster extends roughly from x = 0.0 to 0.6 and y = 0.0 to 0.5.
* **Relationship:** There is a clear separation between the two clusters along the diagonal. "True" statements have significantly higher values for both `a_ij^T t_G` and `a_ij^T t_P` projections compared to "False" statements.
**Right Plot: Negated Statements**
* **Trend Verification:** The two data series show an inverse relationship. The "False" cluster is in the upper-left, and the "True" cluster is in the lower-right.
* **Data Distribution:**
* **"False" (Red):** Points are clustered in the upper-left quadrant. Approximate centroid: x ≈ -0.4, y ≈ 0.1. The cluster extends roughly from x = -0.8 to 0.0 and y = -0.2 to 0.4.
* **"True" (Blue):** Points are clustered in the lower-right quadrant. Approximate centroid: x ≈ 0.2, y ≈ -0.4. The cluster extends roughly from x = -0.2 to 0.5 and y = -1.0 to 0.0.
* **Relationship:** There is a clear separation between the two clusters. "True" statements have higher `a_ij^T t_G` values but lower `a_ij^T t_P` values compared to "False" statements.
### Key Observations
1. **Distinct Cluster Separation:** In both plots, the "True" and "False" data points form distinct, non-overlapping clusters, indicating the projections are highly discriminative for the given task.
2. **Opposite Patterns:** The spatial relationship between "True" and "False" clusters is inverted between the two conditions. Affirmative statements show a positive correlation for both classes, while negated statements show a negative correlation between the classes.
3. **Axis Range Utilization:** The "Affirmative Statements" plot uses the positive x-axis range more heavily, while the "Negated Statements" plot uses the negative y-axis range more heavily for its "True" cluster.
### Interpretation
This visualization demonstrates how a model's internal activations (projected onto two directions, `t_G` and `t_P`) encode truth value differently depending on linguistic context (affirmation vs. negation).
* **For Affirmative Statements:** The model's representation of a "True" statement involves high activation along both the `t_G` and `t_P` directions. A "False" statement involves low activation along both. This suggests `t_G` and `t_P` may be correlated features for affirming truth in simple statements.
* **For Negated Statements:** The pattern flips. A "True" negated statement (e.g., "It is not raining") is characterized by high `t_G` but low `t_P` activation. A "False" negated statement shows the opposite. This indicates that the `t_P` direction may be sensitive to the *presence* of a concept, while `t_G` is sensitive to its *factual validity*, and negation decouples these two signals.
* **Underlying Mechanism:** The plots provide visual evidence that the model uses a compositional representation where truth (`t_G`) and a secondary property (`t_P`, possibly related to grammatical polarity or surface-level assertion) are processed by distinct but interacting neural pathways. The clear separation suggests these projections are effective probes for understanding the model's reasoning about truth and negation.