## Scatter Plots: Projection of activations on t_G and t_P
### Overview
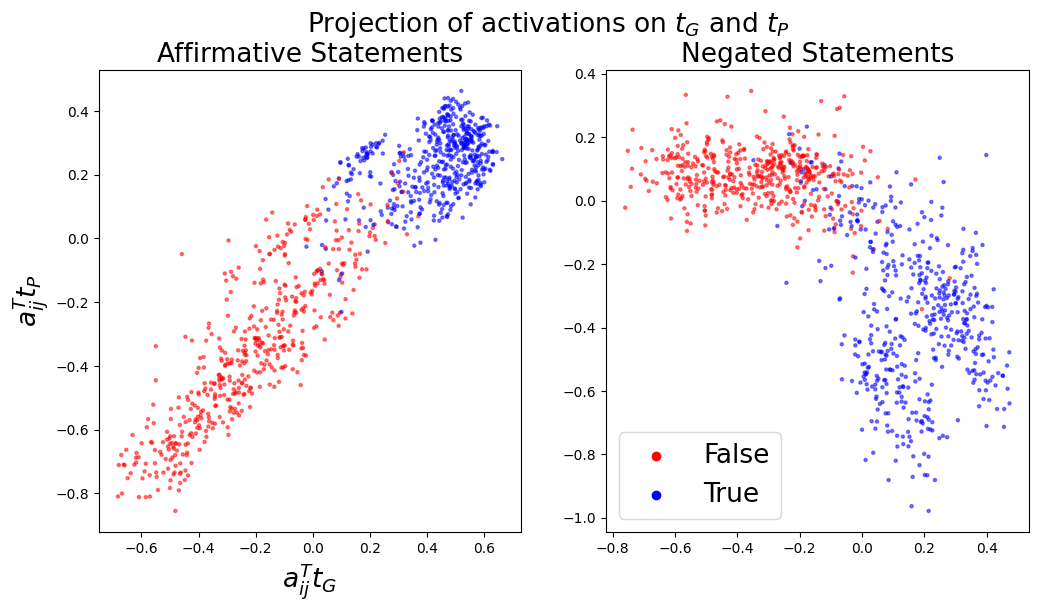
The image contains two scatter plots comparing the projection of activations on two variables, **t_G** (likely a ground truth or target variable) and **t_P** (possibly a predicted or processed variable). The plots are split into **Affirmative Statements** (left) and **Negated Statements** (right). Points are color-coded: **red** for "False" and **blue** for "True".
---
### Components/Axes
- **X-axis**: Labeled **a^T_ij t_G** (projection of activations on t_G), ranging from **-0.8 to 0.6**.
- **Y-axis**: Labeled **a^T_ij t_P** (projection of activations on t_P), ranging from **-0.8 to 0.4**.
- **Legend**: Located in the lower-right corner of the **Negated Statements** plot.
- **Red**: "False"
- **Blue**: "True"
---
### Detailed Analysis
#### Affirmative Statements (Left Plot)
- **Red points ("False")**:
- Clustered in the **lower-left quadrant** (x ≈ -0.6 to 0.0, y ≈ -0.8 to -0.2).
- Some outliers extend toward the upper-right quadrant (x ≈ 0.2–0.4, y ≈ 0.0–0.2).
- **Blue points ("True")**:
- Concentrated in the **upper-right quadrant** (x ≈ 0.0–0.6, y ≈ 0.0–0.4).
- A few outliers appear in the lower-left quadrant (x ≈ -0.4–0.0, y ≈ -0.4–-0.2).
#### Negated Statements (Right Plot)
- **Red points ("False")**:
- Dominant in the **upper-left quadrant** (x ≈ -0.8 to -0.2, y ≈ -0.2 to 0.2).
- Fewer points in the lower-right quadrant (x ≈ 0.0–0.4, y ≈ -0.6 to -0.2).
- **Blue points ("True")**:
- Clustered in the **lower-right quadrant** (x ≈ 0.0–0.4, y ≈ -0.8 to -0.2).
- Some outliers in the upper-left quadrant (x ≈ -0.6–-0.2, y ≈ -0.4–-0.2).
---
### Key Observations
1. **Affirmative Statements**:
- "True" statements (blue) show a stronger positive correlation between **t_G** and **t_P** (higher x and y values).
- "False" statements (red) are more dispersed, with a tendency toward negative projections on **t_P**.
2. **Negated Statements**:
- "False" statements (red) are tightly clustered in the upper-left quadrant, suggesting a consistent negative projection on **t_G** and near-zero projection on **t_P**.
- "True" statements (blue) are concentrated in the lower-right quadrant, indicating a positive projection on **t_G** and negative projection on **t_P**.
3. **Outliers**:
- A small number of red points in the affirmative plot appear in the upper-right quadrant, suggesting rare cases where "False" statements align with positive projections.
- In the negated plot, blue points in the upper-left quadrant may represent anomalies where "True" statements exhibit negative projections on both variables.
---
### Interpretation
- **Affirmative Statements**:
The separation between "True" and "False" suggests the model distinguishes between valid and invalid affirmative claims based on their projections. "True" statements align more closely with the expected relationship between **t_G** and **t_P**, while "False" statements deviate, particularly in their negative **t_P** values.
- **Negated Statements**:
The clustering of "False" statements in the upper-left quadrant implies that negated claims are often associated with negative **t_G** projections and neutral **t_P** values. "True" negated statements (blue) show a paradoxical pattern: positive **t_G** but negative **t_P**, which may indicate a model bias or error in handling negated truths.
- **Model Behavior**:
The distinct groupings suggest the model processes affirmative and negated statements differently. Affirmative "True" statements are more consistent with the target variables, while negated "True" statements exhibit conflicting projections, potentially highlighting a need for improved handling of negation in the model.
- **Uncertainties**:
The exact numerical values of individual points are not labeled, so precise trends (e.g., slopes) cannot be quantified. The clustering patterns are approximate and based on visual inspection.