## Dot Plot: Probe Predictions for Layer 44
### Overview
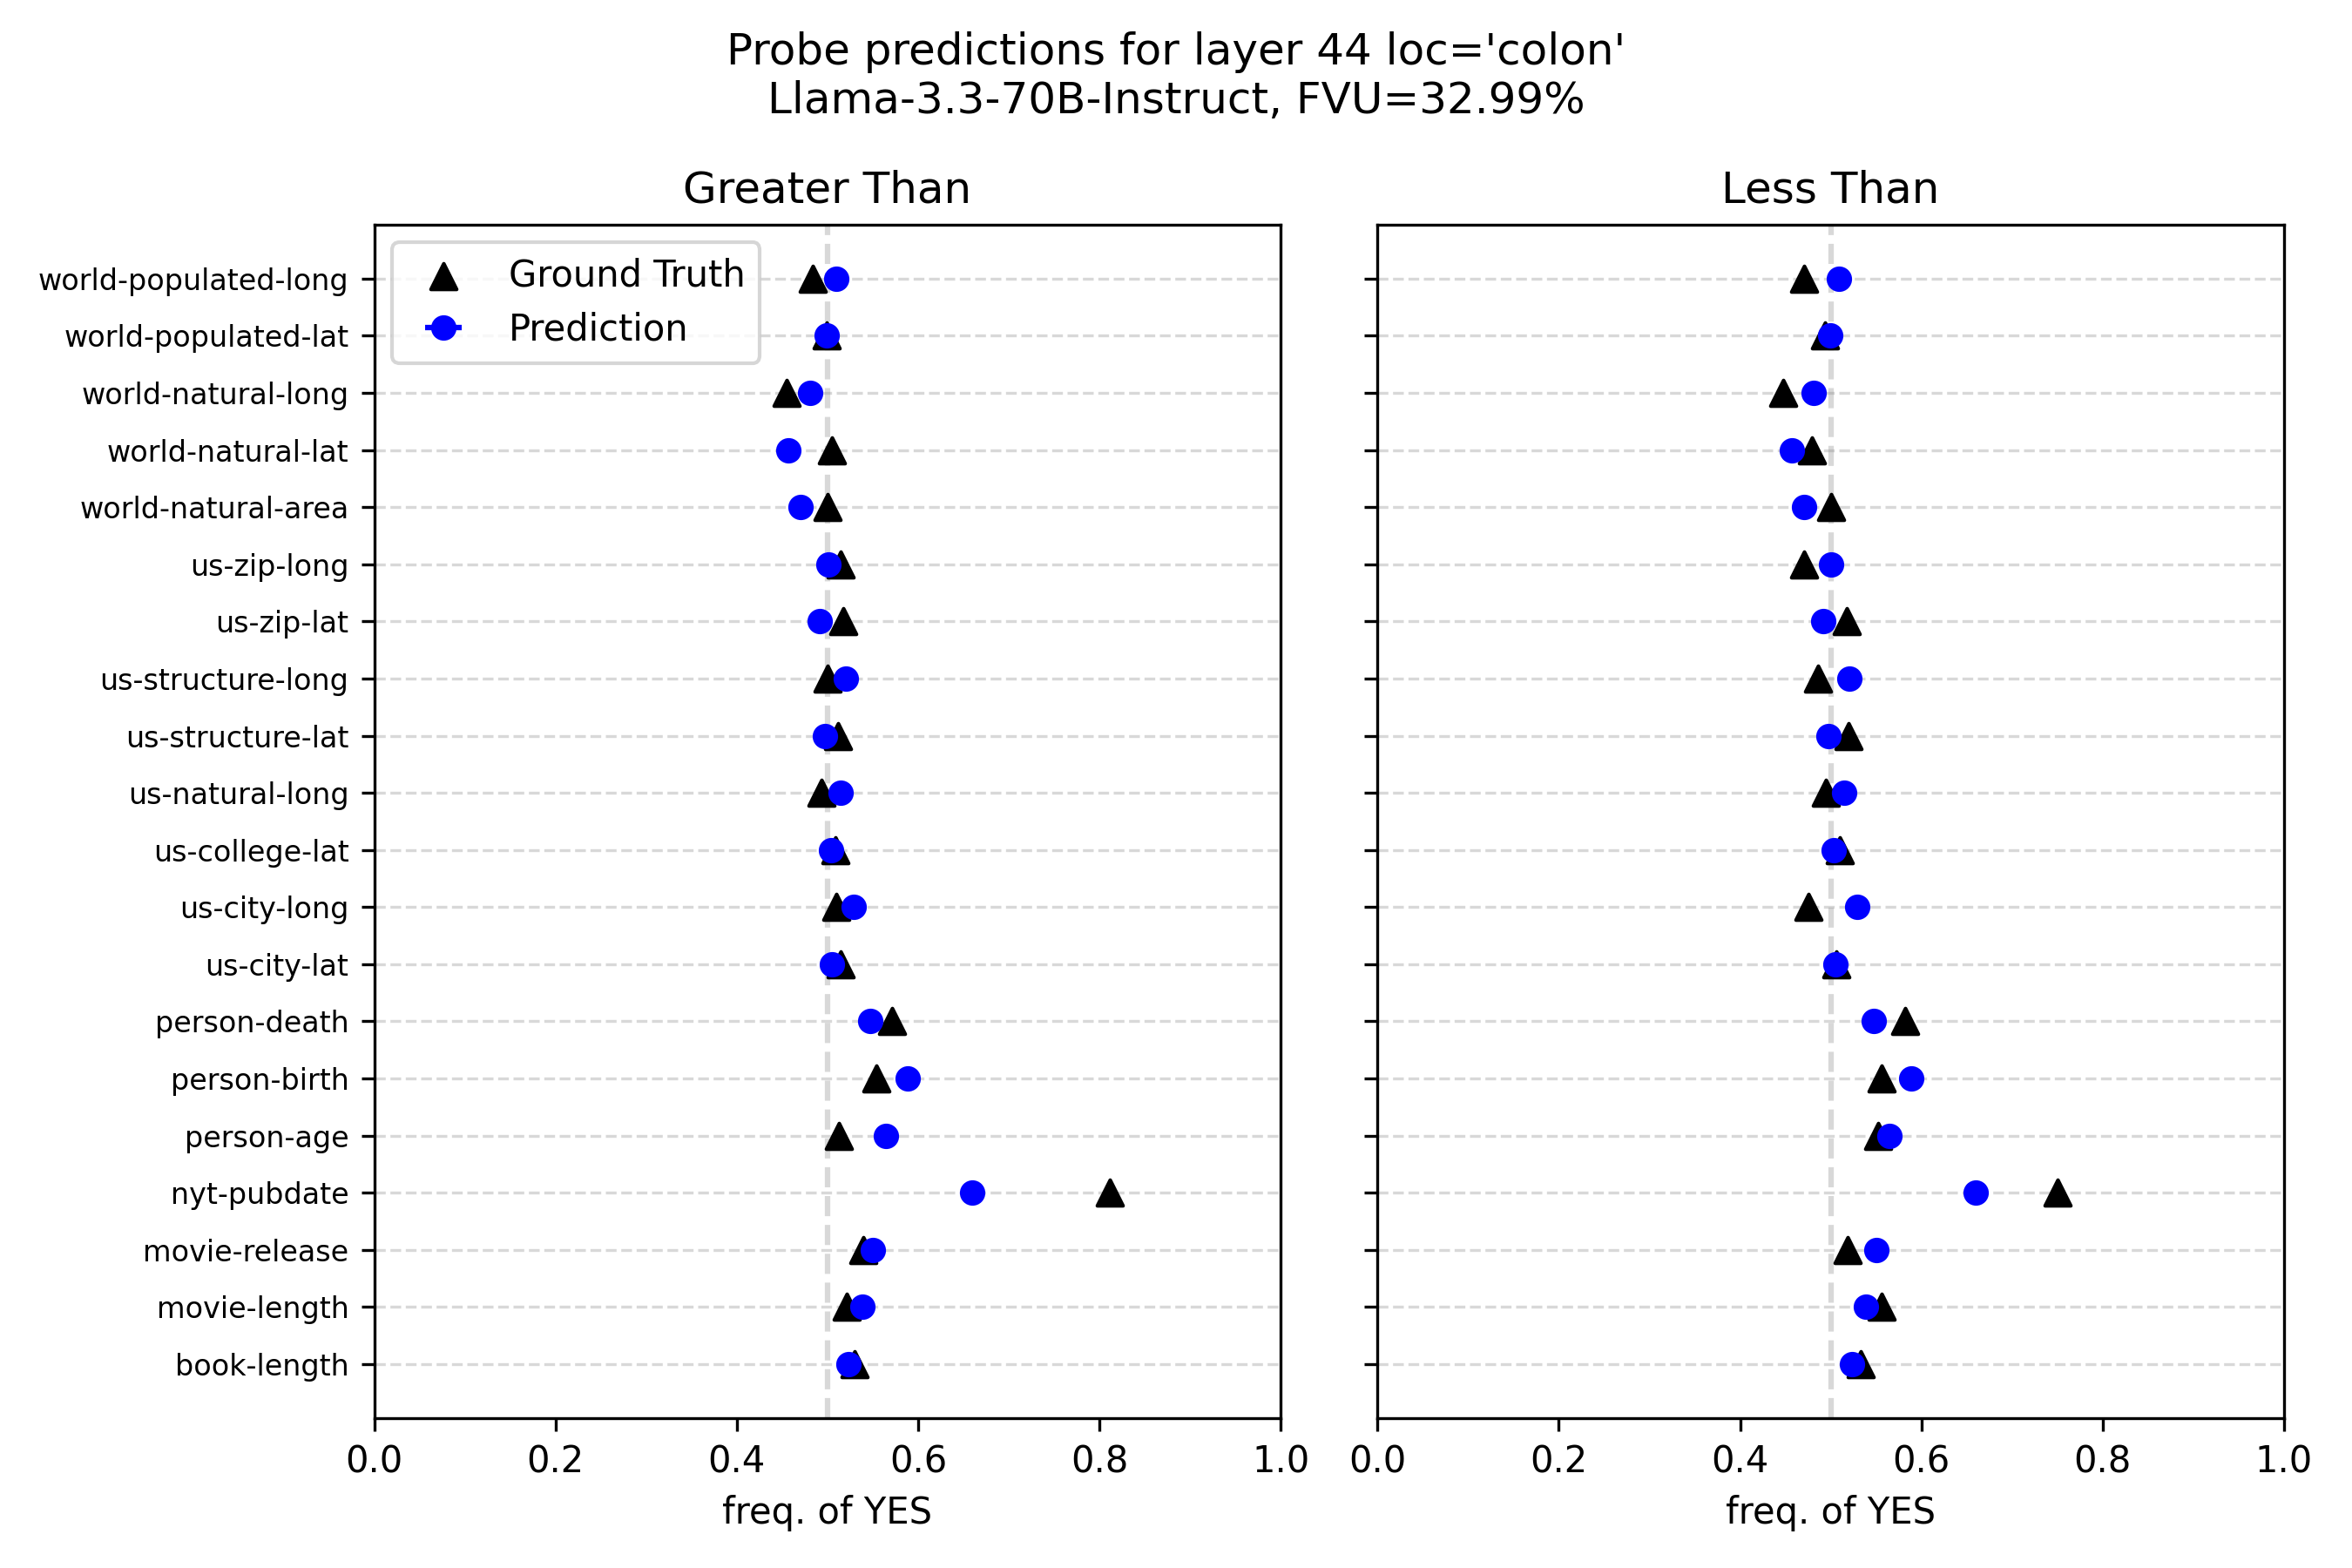
The image presents two dot plots comparing "Ground Truth" and "Prediction" values for various categories. The plots are separated into "Greater Than" and "Less Than" groups, likely referring to a threshold or comparison point. The data represents probe predictions for layer 44, with the model being Llama-3.3-70B-Instruct, and FVU (Fraction of Variance Unexplained) being 32.99%.
### Components/Axes
* **Title:** Probe predictions for layer 44 loc='colon' Llama-3.3-70B-Instruct, FVU=32.99%
* **X-axis:** "freq. of YES" with a scale from 0.0 to 1.0, incrementing by 0.2.
* **Y-axis:** Categorical labels on the left side of each plot.
* **Left Plot Title:** Greater Than
* **Right Plot Title:** Less Than
* **Legend:** Located in the top-left corner of the "Greater Than" plot.
* Black Triangle: Ground Truth
* Blue Circle: Prediction
* **Categories (Y-axis labels):**
* world-populated-long
* world-populated-lat
* world-natural-long
* world-natural-lat
* world-natural-area
* us-zip-long
* us-zip-lat
* us-structure-long
* us-structure-lat
* us-natural-long
* us-college-lat
* us-city-long
* us-city-lat
* person-death
* person-birth
* person-age
* nyt-pubdate
* movie-release
* movie-length
* book-length
### Detailed Analysis
**Left Plot: Greater Than**
* **world-populated-long:** Ground Truth (black triangle) ≈ 0.5, Prediction (blue circle) ≈ 0.5
* **world-populated-lat:** Ground Truth ≈ 0.5, Prediction ≈ 0.5
* **world-natural-long:** Ground Truth ≈ 0.5, Prediction ≈ 0.45
* **world-natural-lat:** Ground Truth ≈ 0.5, Prediction ≈ 0.5
* **world-natural-area:** Ground Truth ≈ 0.5, Prediction ≈ 0.45
* **us-zip-long:** Ground Truth ≈ 0.5, Prediction ≈ 0.45
* **us-zip-lat:** Ground Truth ≈ 0.5, Prediction ≈ 0.5
* **us-structure-long:** Ground Truth ≈ 0.5, Prediction ≈ 0.45
* **us-structure-lat:** Ground Truth ≈ 0.5, Prediction ≈ 0.5
* **us-natural-long:** Ground Truth ≈ 0.5, Prediction ≈ 0.45
* **us-college-lat:** Ground Truth ≈ 0.5, Prediction ≈ 0.5
* **us-city-long:** Ground Truth ≈ 0.5, Prediction ≈ 0.45
* **us-city-lat:** Ground Truth ≈ 0.5, Prediction ≈ 0.5
* **person-death:** Ground Truth ≈ 0.6, Prediction ≈ 0.5
* **person-birth:** Ground Truth ≈ 0.6, Prediction ≈ 0.5
* **person-age:** Ground Truth ≈ 0.6, Prediction ≈ 0.5
* **nyt-pubdate:** Ground Truth ≈ 0.8, Prediction ≈ 0.6
* **movie-release:** Ground Truth ≈ 0.5, Prediction ≈ 0.45
* **movie-length:** Ground Truth ≈ 0.5, Prediction ≈ 0.5
* **book-length:** Ground Truth ≈ 0.5, Prediction ≈ 0.5
**Right Plot: Less Than**
* **world-populated-long:** Ground Truth ≈ 0.5, Prediction ≈ 0.5
* **world-populated-lat:** Ground Truth ≈ 0.5, Prediction ≈ 0.5
* **world-natural-long:** Ground Truth ≈ 0.5, Prediction ≈ 0.5
* **world-natural-lat:** Ground Truth ≈ 0.5, Prediction ≈ 0.5
* **world-natural-area:** Ground Truth ≈ 0.5, Prediction ≈ 0.5
* **us-zip-long:** Ground Truth ≈ 0.5, Prediction ≈ 0.5
* **us-zip-lat:** Ground Truth ≈ 0.5, Prediction ≈ 0.5
* **us-structure-long:** Ground Truth ≈ 0.5, Prediction ≈ 0.5
* **us-structure-lat:** Ground Truth ≈ 0.5, Prediction ≈ 0.5
* **us-natural-long:** Ground Truth ≈ 0.5, Prediction ≈ 0.5
* **us-college-lat:** Ground Truth ≈ 0.5, Prediction ≈ 0.5
* **us-city-long:** Ground Truth ≈ 0.5, Prediction ≈ 0.5
* **us-city-lat:** Ground Truth ≈ 0.5, Prediction ≈ 0.5
* **person-death:** Ground Truth ≈ 0.5, Prediction ≈ 0.5
* **person-birth:** Ground Truth ≈ 0.5, Prediction ≈ 0.5
* **person-age:** Ground Truth ≈ 0.5, Prediction ≈ 0.5
* **nyt-pubdate:** Ground Truth ≈ 0.75, Prediction ≈ 0.5
* **movie-release:** Ground Truth ≈ 0.5, Prediction ≈ 0.5
* **movie-length:** Ground Truth ≈ 0.5, Prediction ≈ 0.5
* **book-length:** Ground Truth ≈ 0.5, Prediction ≈ 0.5
### Key Observations
* The "Greater Than" plot shows more variance between Ground Truth and Prediction, especially for "nyt-pubdate".
* The "Less Than" plot shows very little variance between Ground Truth and Prediction, with most values clustered around 0.5.
* For most categories, the prediction values are very similar, hovering around 0.5.
### Interpretation
The plots illustrate the model's performance in predicting whether certain categories are "Greater Than" or "Less Than" some implicit threshold. The low FVU (32.99%) suggests that the model explains a moderate amount of variance in the data. The "Greater Than" plot indicates that the model struggles more with categories that are expected to be above the threshold, as evidenced by the larger discrepancies between Ground Truth and Prediction. The "Less Than" plot shows that the model is more consistent in predicting categories below the threshold, but the clustering around 0.5 suggests a potential bias or lack of confidence in its predictions. The "nyt-pubdate" category stands out as a significant outlier in both plots, indicating a specific challenge for the model in predicting this category.