## Heatmaps: Probe predictions for layer 44 loc='colon'
### Overview
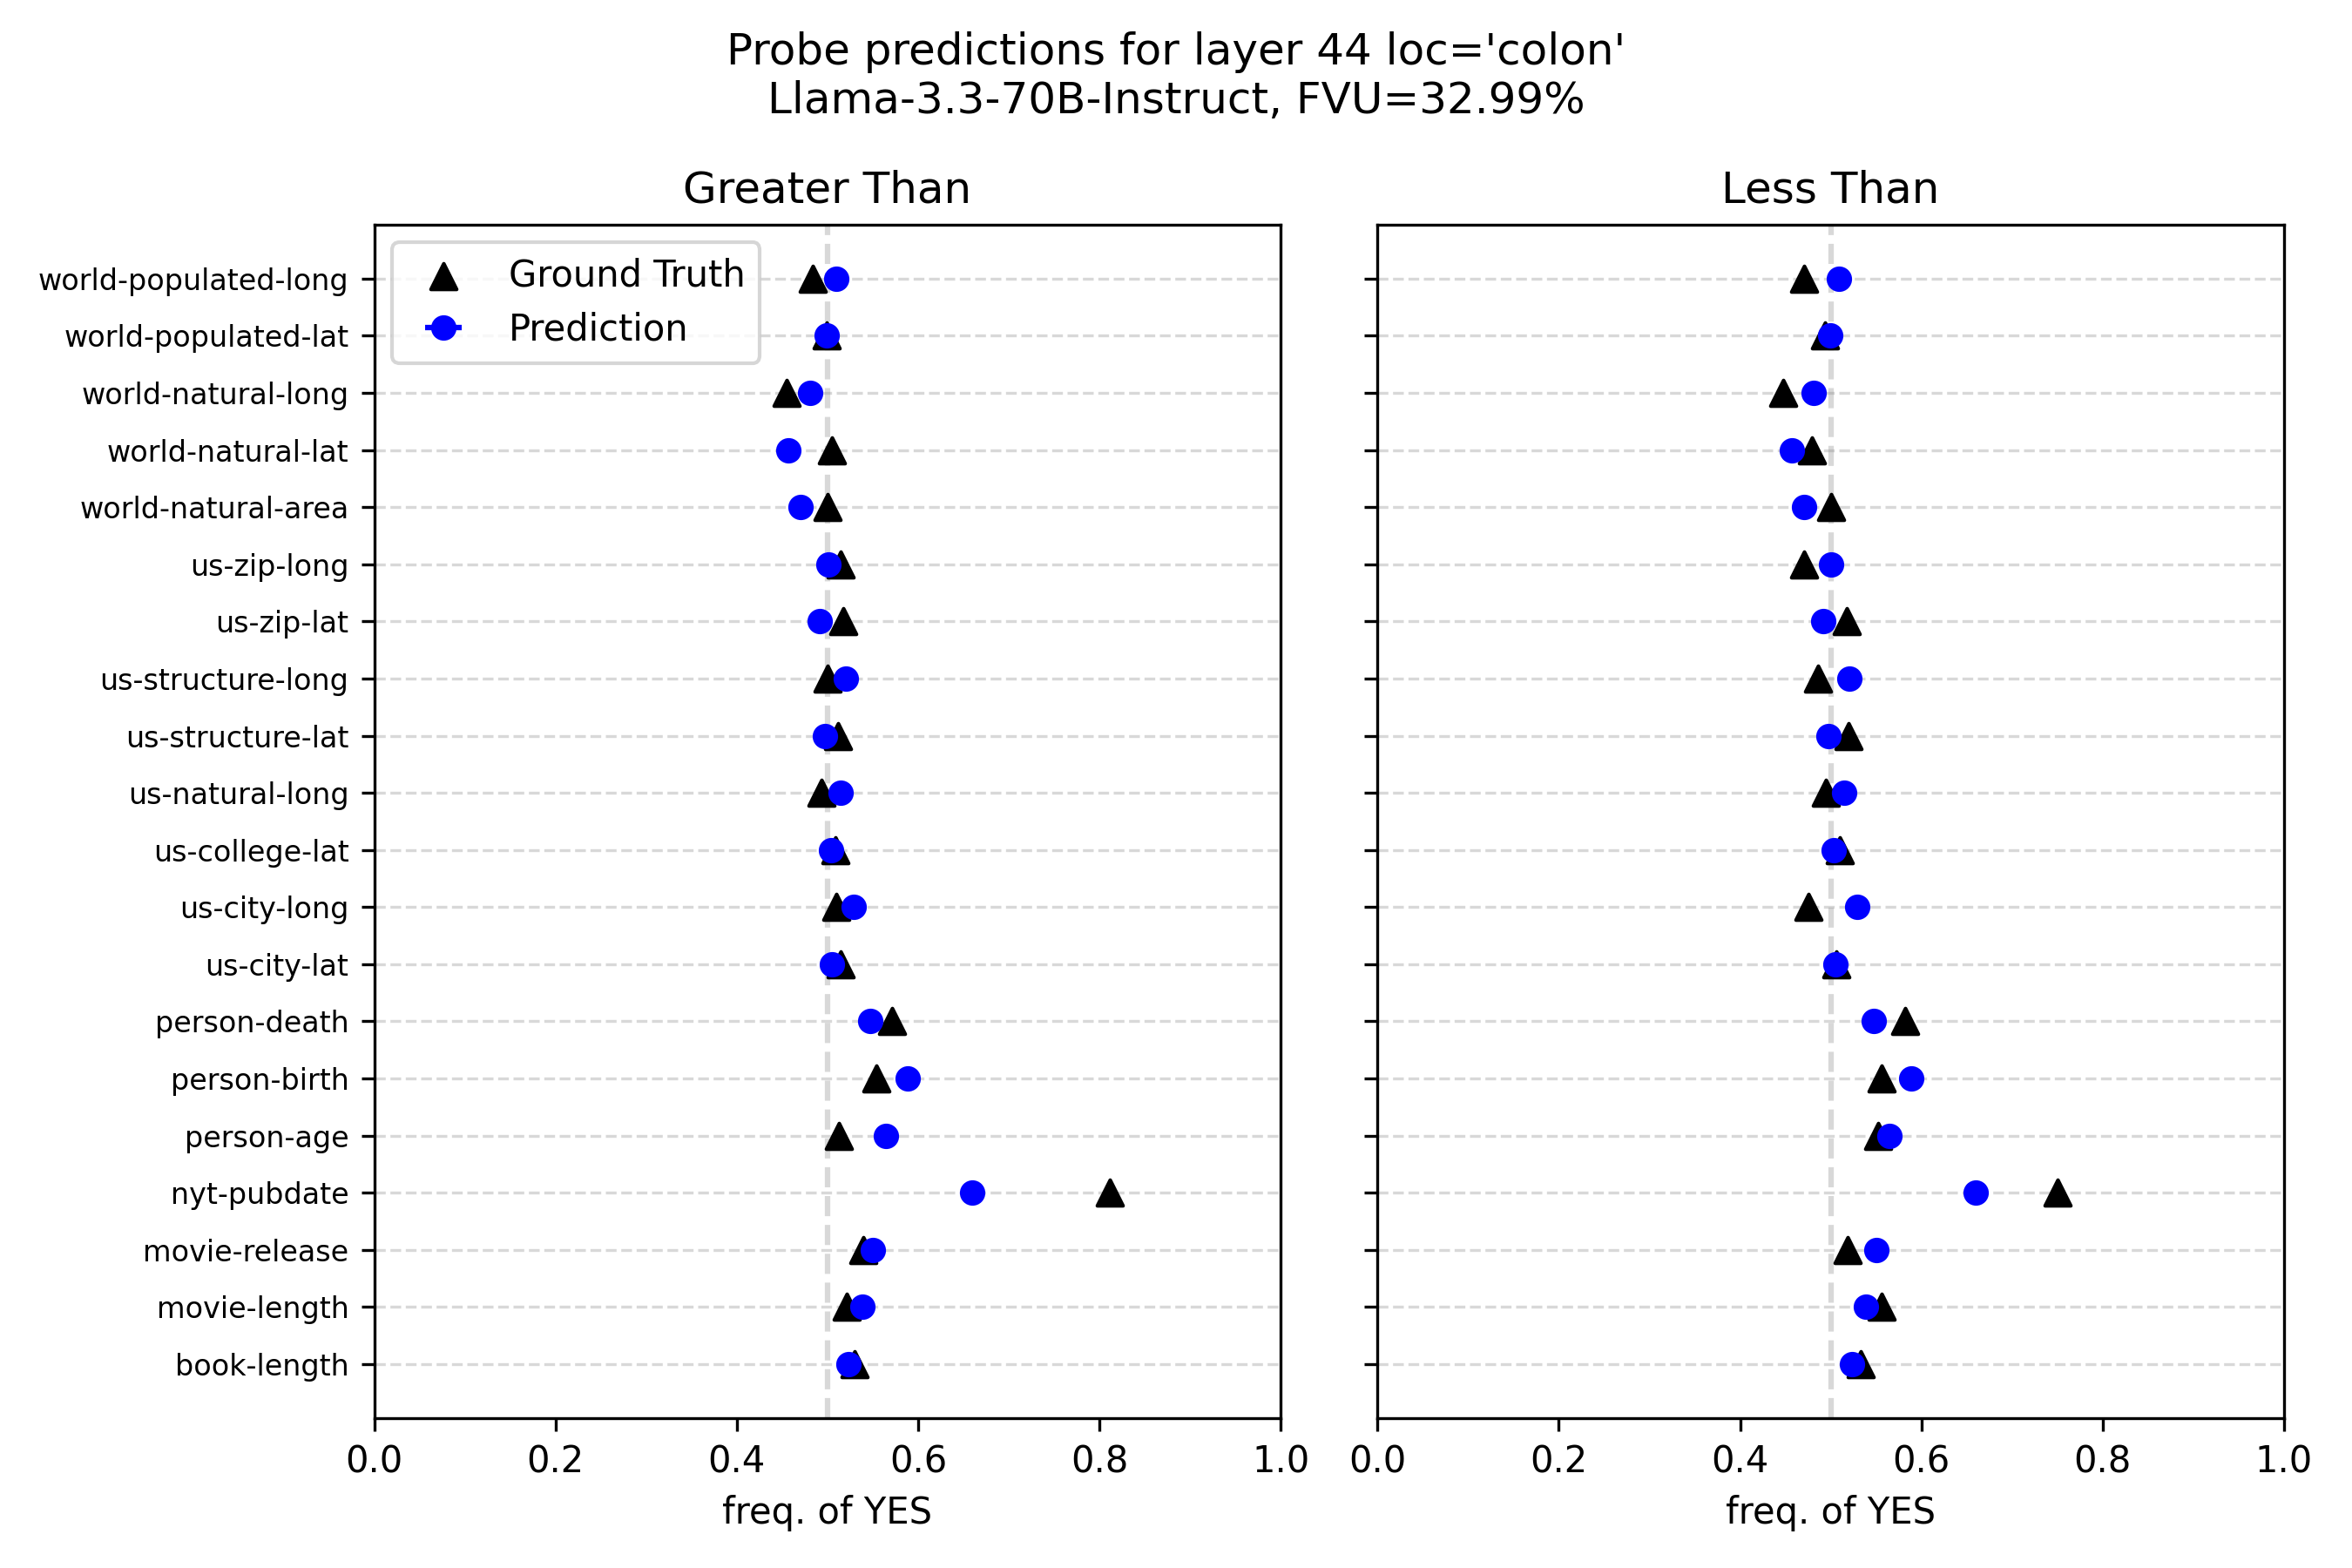
The image presents two heatmaps, side-by-side, visualizing probe predictions for layer 44 with the location specified as 'colon'. The model used is Llama-3.3-70B-Instruct, and the FVU (presumably Feature Value Uncertainty) is 32.99%. The heatmaps compare "Ground Truth" and "Prediction" frequencies for conditions "Greater Than" and "Less Than". The y-axis lists various attributes being probed (e.g., world-populated-long, us-zip-long, person-death). The x-axis represents the frequency of "YES" responses, ranging from 0.0 to 1.0.
### Components/Axes
* **Title:** "Probe predictions for layer 44 loc='colon' Llama-3.3-70B-Instruct, FVU=32.99%" (Top-center)
* **Subtitles:** "Greater Than" (Left heatmap), "Less Than" (Right heatmap)
* **Legend:** Located in the top-left corner of the left heatmap.
* Blue triangles: "Ground Truth"
* Black circles: "Prediction"
* **Y-axis (Both Heatmaps):** Lists the following attributes:
* world-populated-long
* world-populated-lat
* world-natural-long
* world-natural-lat
* world-natural-area
* us-zip-long
* us-zip-lat
* us-structure-long
* us-structure-lat
* us-natural-long
* us-college-lat
* us-city-long
* us-city-lat
* person-death
* person-birth
* person-age
* nyt-pubdate
* movie-release
* movie-length
* book-length
* **X-axis (Both Heatmaps):** "freq. of YES" ranging from 0.0 to 1.0, with markers at 0.2, 0.4, 0.6, 0.8, and 1.0.
### Detailed Analysis or Content Details
**Left Heatmap ("Greater Than")**
The heatmap shows the frequency of "YES" responses for the "Greater Than" condition. The color intensity represents the frequency.
* **world-populated-long:** Ground Truth: ~0.65, Prediction: ~0.55
* **world-populated-lat:** Ground Truth: ~0.6, Prediction: ~0.5
* **world-natural-long:** Ground Truth: ~0.6, Prediction: ~0.5
* **world-natural-lat:** Ground Truth: ~0.55, Prediction: ~0.5
* **world-natural-area:** Ground Truth: ~0.5, Prediction: ~0.45
* **us-zip-long:** Ground Truth: ~0.5, Prediction: ~0.4
* **us-zip-lat:** Ground Truth: ~0.45, Prediction: ~0.4
* **us-structure-long:** Ground Truth: ~0.5, Prediction: ~0.4
* **us-structure-lat:** Ground Truth: ~0.45, Prediction: ~0.4
* **us-natural-long:** Ground Truth: ~0.5, Prediction: ~0.4
* **us-college-lat:** Ground Truth: ~0.45, Prediction: ~0.4
* **us-city-long:** Ground Truth: ~0.5, Prediction: ~0.4
* **us-city-lat:** Ground Truth: ~0.45, Prediction: ~0.4
* **person-death:** Ground Truth: ~0.5, Prediction: ~0.45
* **person-birth:** Ground Truth: ~0.5, Prediction: ~0.45
* **person-age:** Ground Truth: ~0.5, Prediction: ~0.45
* **nyt-pubdate:** Ground Truth: ~0.5, Prediction: ~0.45
* **movie-release:** Ground Truth: ~0.45, Prediction: ~0.4
* **movie-length:** Ground Truth: ~0.4, Prediction: ~0.35
* **book-length:** Ground Truth: ~0.4, Prediction: ~0.35
**Right Heatmap ("Less Than")**
The heatmap shows the frequency of "YES" responses for the "Less Than" condition.
* **world-populated-long:** Ground Truth: ~0.6, Prediction: ~0.55
* **world-populated-lat:** Ground Truth: ~0.6, Prediction: ~0.5
* **world-natural-long:** Ground Truth: ~0.6, Prediction: ~0.5
* **world-natural-lat:** Ground Truth: ~0.55, Prediction: ~0.5
* **world-natural-area:** Ground Truth: ~0.5, Prediction: ~0.45
* **us-zip-long:** Ground Truth: ~0.5, Prediction: ~0.4
* **us-zip-lat:** Ground Truth: ~0.45, Prediction: ~0.4
* **us-structure-long:** Ground Truth: ~0.5, Prediction: ~0.4
* **us-structure-lat:** Ground Truth: ~0.45, Prediction: ~0.4
* **us-natural-long:** Ground Truth: ~0.5, Prediction: ~0.4
* **us-college-lat:** Ground Truth: ~0.45, Prediction: ~0.4
* **us-city-long:** Ground Truth: ~0.5, Prediction: ~0.4
* **us-city-lat:** Ground Truth: ~0.45, Prediction: ~0.4
* **person-death:** Ground Truth: ~0.5, Prediction: ~0.45
* **person-birth:** Ground Truth: ~0.5, Prediction: ~0.45
* **person-age:** Ground Truth: ~0.5, Prediction: ~0.45
* **nyt-pubdate:** Ground Truth: ~0.5, Prediction: ~0.45
* **movie-release:** Ground Truth: ~0.45, Prediction: ~0.4
* **movie-length:** Ground Truth: ~0.4, Prediction: ~0.35
* **book-length:** Ground Truth: ~0.4, Prediction: ~0.35
### Key Observations
* In both heatmaps, the "Ground Truth" (blue triangles) generally shows slightly higher frequencies of "YES" responses compared to the "Prediction" (black circles).
* The attributes related to location (e.g., world-populated-long/lat, us-zip-long/lat) tend to have higher frequencies of "YES" than attributes related to people or media.
* The differences between "Ground Truth" and "Prediction" appear relatively consistent across all attributes, suggesting a systematic bias in the model's predictions.
* The frequencies are generally clustered between 0.4 and 0.65 for both "Greater Than" and "Less Than" conditions.
### Interpretation
The data suggests that the Llama-3.3-70B-Instruct model, when probed at layer 44 with the 'colon' location, demonstrates a tendency to underestimate the frequency of "YES" responses for the probed attributes, compared to the actual "Ground Truth". This underestimation is consistent across different attribute types, indicating a potential systematic bias in the model's internal representation or prediction mechanism. The higher frequencies observed for location-based attributes might indicate that the model is better at capturing spatial relationships or patterns than other types of information. The FVU of 32.99% suggests a moderate level of uncertainty in the model's predictions, which could contribute to the observed discrepancies. The heatmaps provide a visual comparison of the model's performance, highlighting areas where its predictions align with or deviate from the ground truth. Further investigation is needed to understand the root cause of the observed bias and improve the model's accuracy.