TECHNICAL ASSET FINGERPRINT
f82312c63f3278f8c939b98a
Click to view fullscreen
Press ESC or click to close
FOUND IN PAPERS
EXPERT: healer-alpha-free VERSION 1
RUNTIME: free/openrouter/healer-alpha
INTEL_VERIFIED
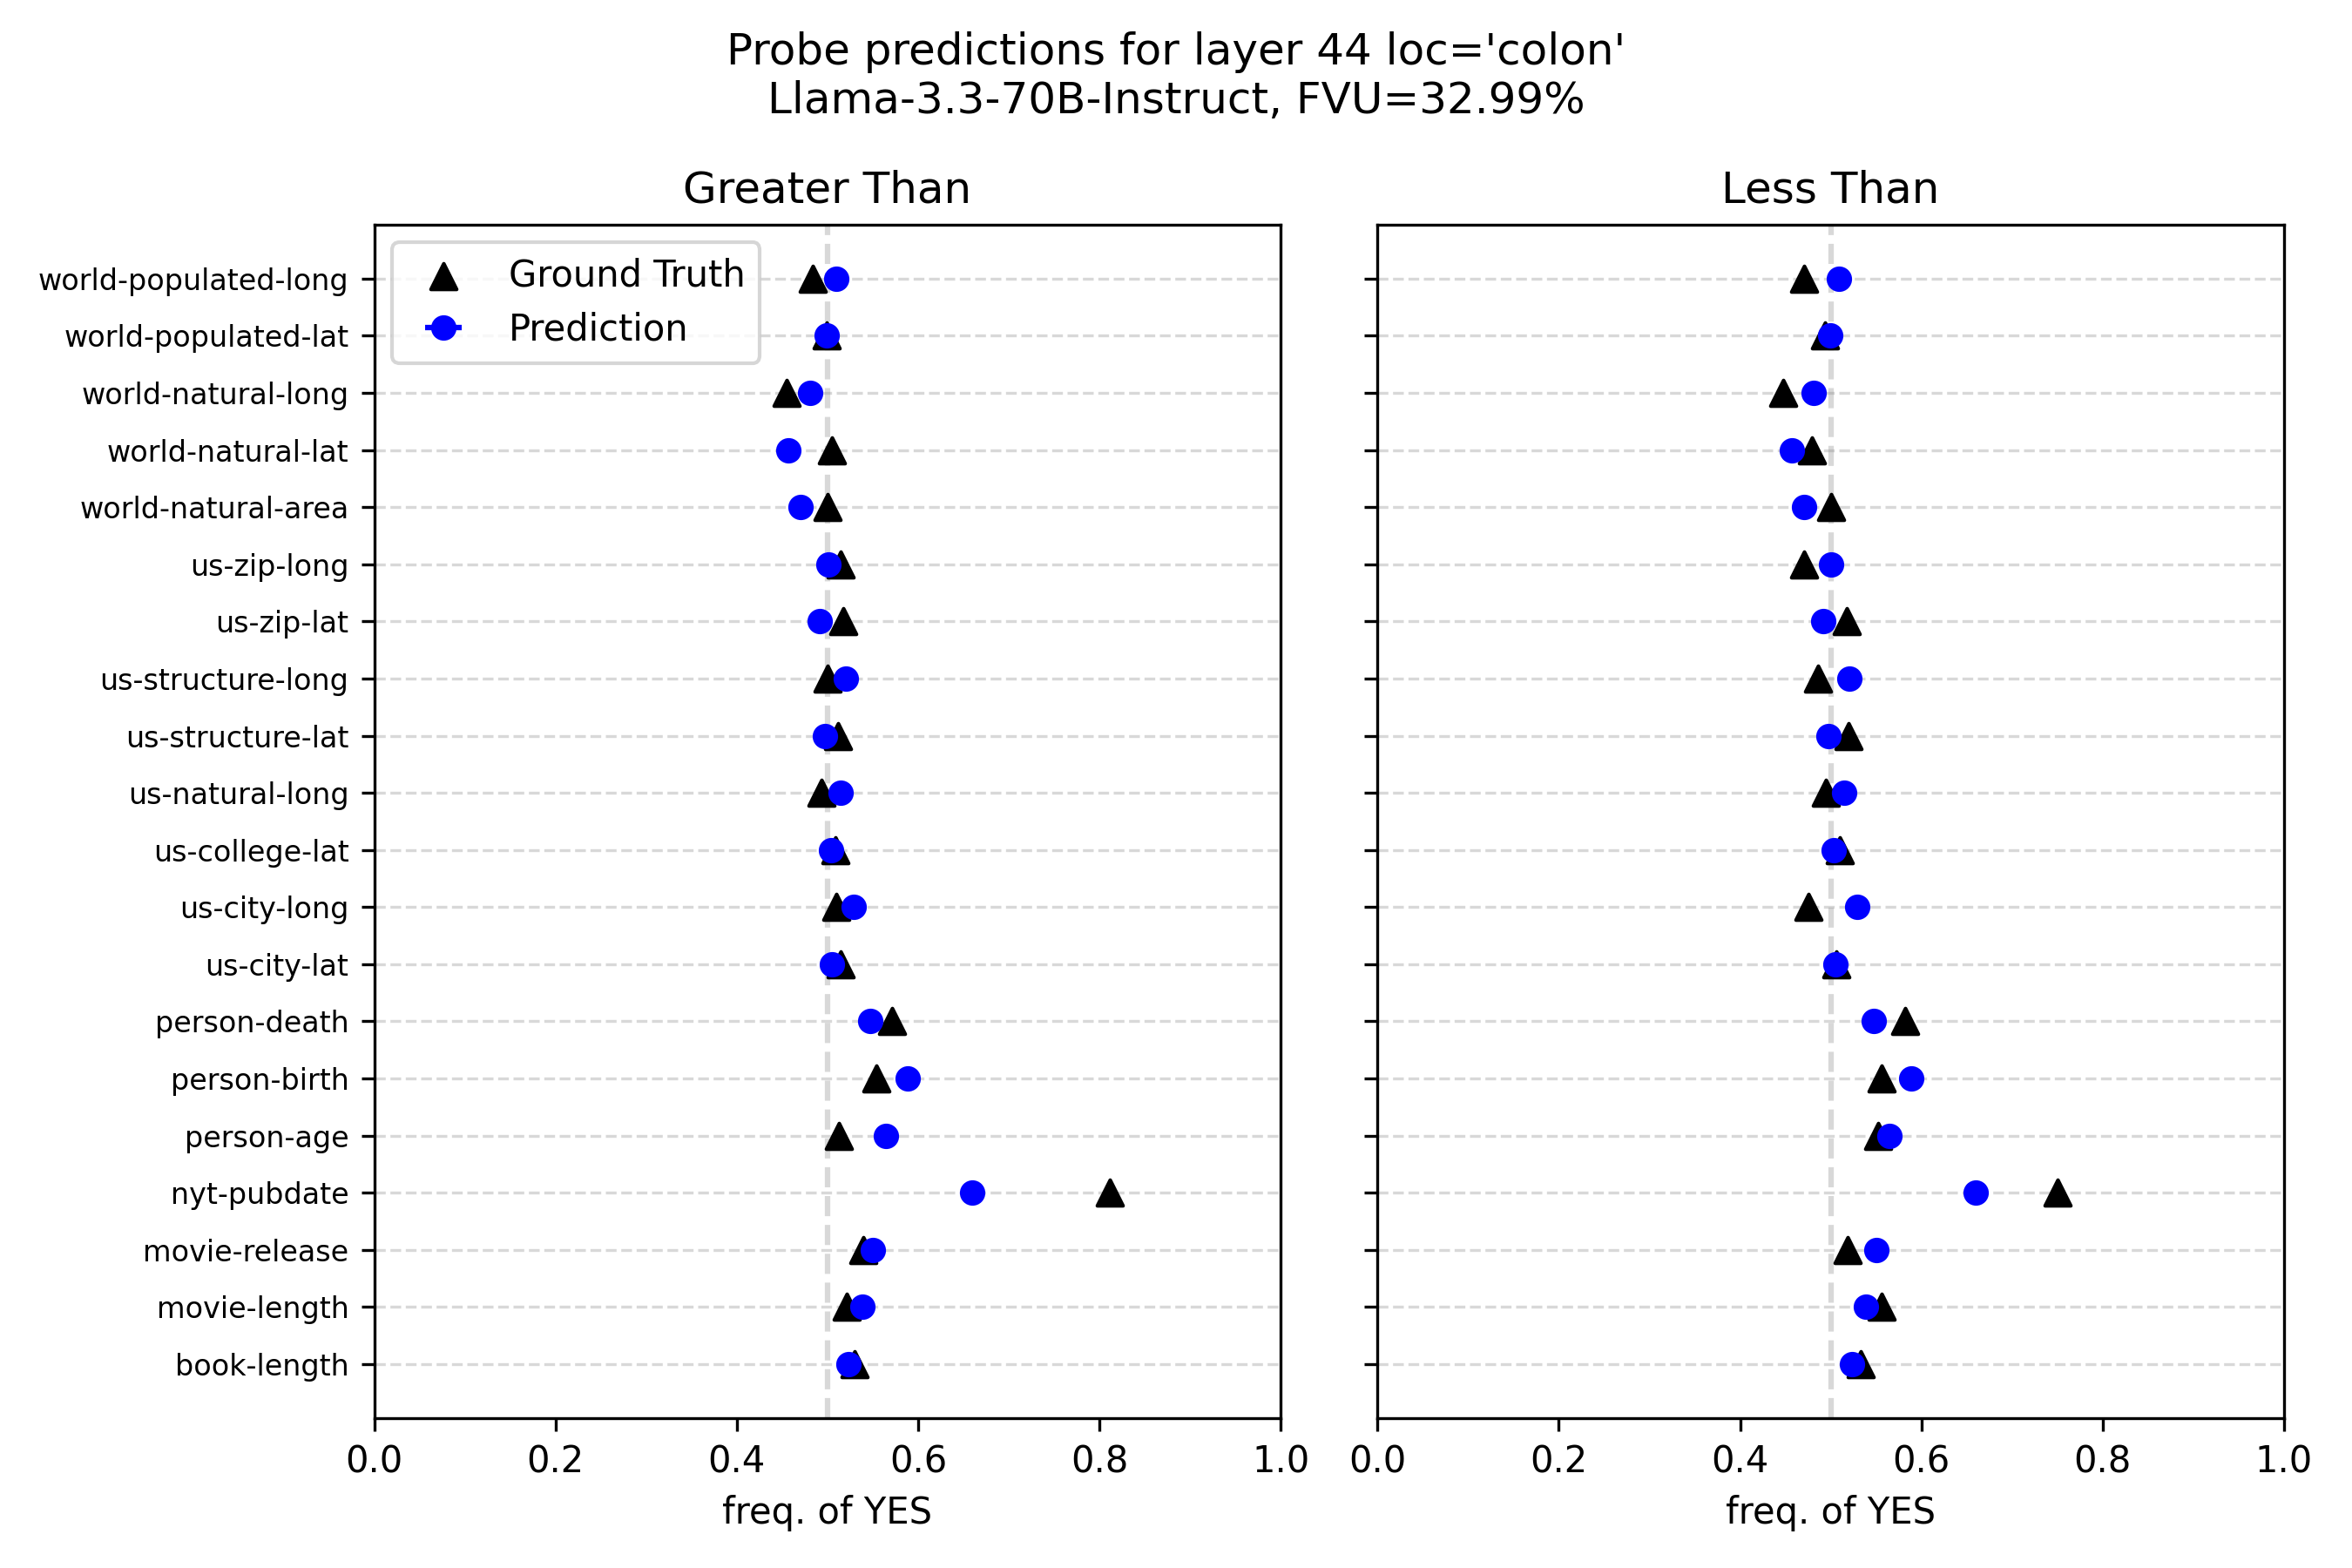
## Dot Plot Comparison: Probe Predictions vs. Ground Truth
### Overview
This image displays a technical chart comparing "Ground Truth" frequencies to model "Prediction" frequencies for a series of categorical attributes. The chart is titled **"Probe predictions for layer 44 loc='colon'"** and specifies the model as **"Llama-3.3-70B-Instruct"** with an **FVU (Fraction of Variance Unexplained) of 32.99%**. The visualization consists of two side-by-side panels labeled **"Greater Than"** (left) and **"Less Than"** (right), each plotting the same set of categories against a shared x-axis.
### Components/Axes
* **Main Title:** "Probe predictions for layer 44 loc='colon'"
* **Subtitle:** "Llama-3.3-70B-Instruct, FVU=32.99%"
* **Panel Titles:**
* Left Panel: "Greater Than"
* Right Panel: "Less Than"
* **Y-Axis (Categories):** A shared vertical axis listing 20 categorical attributes. From top to bottom:
1. world-populated-long
2. world-populated-lat
3. world-natural-long
4. world-natural-lat
5. world-natural-area
6. us-zip-long
7. us-zip-lat
8. us-structure-long
9. us-structure-lat
10. us-natural-long
11. us-college-lat
12. us-city-long
13. us-city-lat
14. person-death
15. person-birth
16. person-age
17. nyt-pubdate
18. movie-release
19. movie-length
20. book-length
* **X-Axis (Both Panels):** Labeled **"freq. of YES"**. The scale runs from **0.0 to 1.0**, with major tick marks at 0.0, 0.2, 0.4, 0.6, 0.8, and 1.0. A dashed vertical gray line is positioned at **0.5** in both panels, serving as a reference for a balanced frequency.
* **Legend (Top-Left of Left Panel):**
* **Black Triangle (▲):** "Ground Truth"
* **Blue Circle (●):** "Prediction"
### Detailed Analysis
The chart plots the frequency of a "YES" response for each category under two conditions ("Greater Than" and "Less Than"). Each category has a pair of data points: a black triangle (ground truth) and a blue circle (model prediction). The approximate values are extracted below.
**Trend Verification:** For most categories, the ground truth and prediction points are clustered very closely together, typically within 0.01 to 0.03 on the x-axis. The predictions (blue circles) are frequently positioned slightly to the right of the ground truth (black triangles), indicating a minor but consistent over-prediction of the "YES" frequency.
**Category-by-Category Data Points (Approximate Values):**
| Category | Greater Than: Ground Truth (▲) | Greater Than: Prediction (●) | Less Than: Ground Truth (▲) | Less Than: Prediction (●) |
| :--- | :--- | :--- | :--- | :--- |
| world-populated-long | ~0.50 | ~0.52 | ~0.50 | ~0.52 |
| world-populated-lat | ~0.50 | ~0.51 | ~0.50 | ~0.51 |
| world-natural-long | ~0.45 | ~0.48 | ~0.45 | ~0.48 |
| world-natural-lat | ~0.50 | ~0.48 | ~0.50 | ~0.48 |
| world-natural-area | ~0.50 | ~0.48 | ~0.50 | ~0.48 |
| us-zip-long | ~0.50 | ~0.51 | ~0.48 | ~0.51 |
| us-zip-lat | ~0.50 | ~0.51 | ~0.50 | ~0.51 |
| us-structure-long | ~0.50 | ~0.51 | ~0.48 | ~0.51 |
| us-structure-lat | ~0.50 | ~0.51 | ~0.50 | ~0.51 |
| us-natural-long | ~0.50 | ~0.51 | ~0.48 | ~0.51 |
| us-college-lat | ~0.50 | ~0.51 | ~0.50 | ~0.51 |
| us-city-long | ~0.50 | ~0.51 | ~0.48 | ~0.51 |
| us-city-lat | ~0.50 | ~0.51 | ~0.50 | ~0.51 |
| person-death | ~0.55 | ~0.53 | ~0.55 | ~0.53 |
| person-birth | ~0.53 | ~0.57 | ~0.53 | ~0.57 |
| person-age | ~0.50 | ~0.55 | ~0.50 | ~0.55 |
| **nyt-pubdate** | **~0.80** | **~0.65** | **~0.75** | **~0.65** |
| movie-release | ~0.50 | ~0.51 | ~0.50 | ~0.51 |
| movie-length | ~0.50 | ~0.51 | ~0.50 | ~0.51 |
| book-length | ~0.50 | ~0.51 | ~0.50 | ~0.51 |
### Key Observations
1. **High General Alignment:** For 19 out of 20 categories, the model's predictions are highly accurate, closely tracking the ground truth frequencies. The points are nearly overlapping in many cases.
2. **Systematic Slight Over-prediction:** In the majority of aligned cases, the blue prediction circle is slightly to the right of the black ground truth triangle, suggesting a minor bias toward predicting a higher frequency of "YES".
3. **Major Outlier - `nyt-pubdate`:** The category `nyt-pubdate` (New York Times publication date) is a significant outlier. The ground truth frequency is very high (~0.75-0.80), but the model's prediction is substantially lower (~0.65) in both panels. This represents the largest discrepancy in the chart.
4. **Consistency Across Conditions:** The pattern of alignment and the outlier status of `nyt-pubdate` are consistent between the "Greater Than" and "Less Than" panels.
### Interpretation
This chart evaluates the performance of a probe applied to layer 44 of the Llama-3.3-70B-Instruct model. The probe's task appears to be predicting the frequency with which a "YES" answer is correct for comparative statements (e.g., "Is X greater than Y?") about various factual attributes.
* **What the data suggests:** The model's internal representations at this specific layer and location (`loc='colon'`) are highly effective at capturing the statistical frequency of correct comparative answers for most tested attributes. The low FVU of 32.99% quantitatively supports this, indicating the probe explains about 67% of the variance in the data.
* **The `nyt-pubdate` Anomaly:** The stark failure on `nyt-pubdate` is the most critical finding. It suggests the model's internal encoding for this specific temporal/factual attribute is poorly aligned with the ground truth frequency. This could be due to several factors: the attribute might be less represented in training data, its comparative logic might be more complex, or the probe at this layer may not be the right tool to extract this particular information.
* **Relationship Between Elements:** The side-by-side panels confirm that the model's performance (and its specific failure) is robust across two different comparative framings ("Greater Than" vs. "Less Than"). The consistent slight over-prediction bias might indicate a general tendency in the model's output distribution for these types of queries.
* **Why it matters:** This type of analysis is crucial for interpretability research. It helps identify *where* in a neural network certain types of knowledge are encoded and *how well* that encoding can be decoded. The outlier points to a specific weakness or a different representational scheme for that piece of knowledge, guiding further investigation into the model's internal structure.
DECODING INTELLIGENCE...