## Scatter Plot: Probe Predictions for Layer 44 (loc='colon')
### Overview
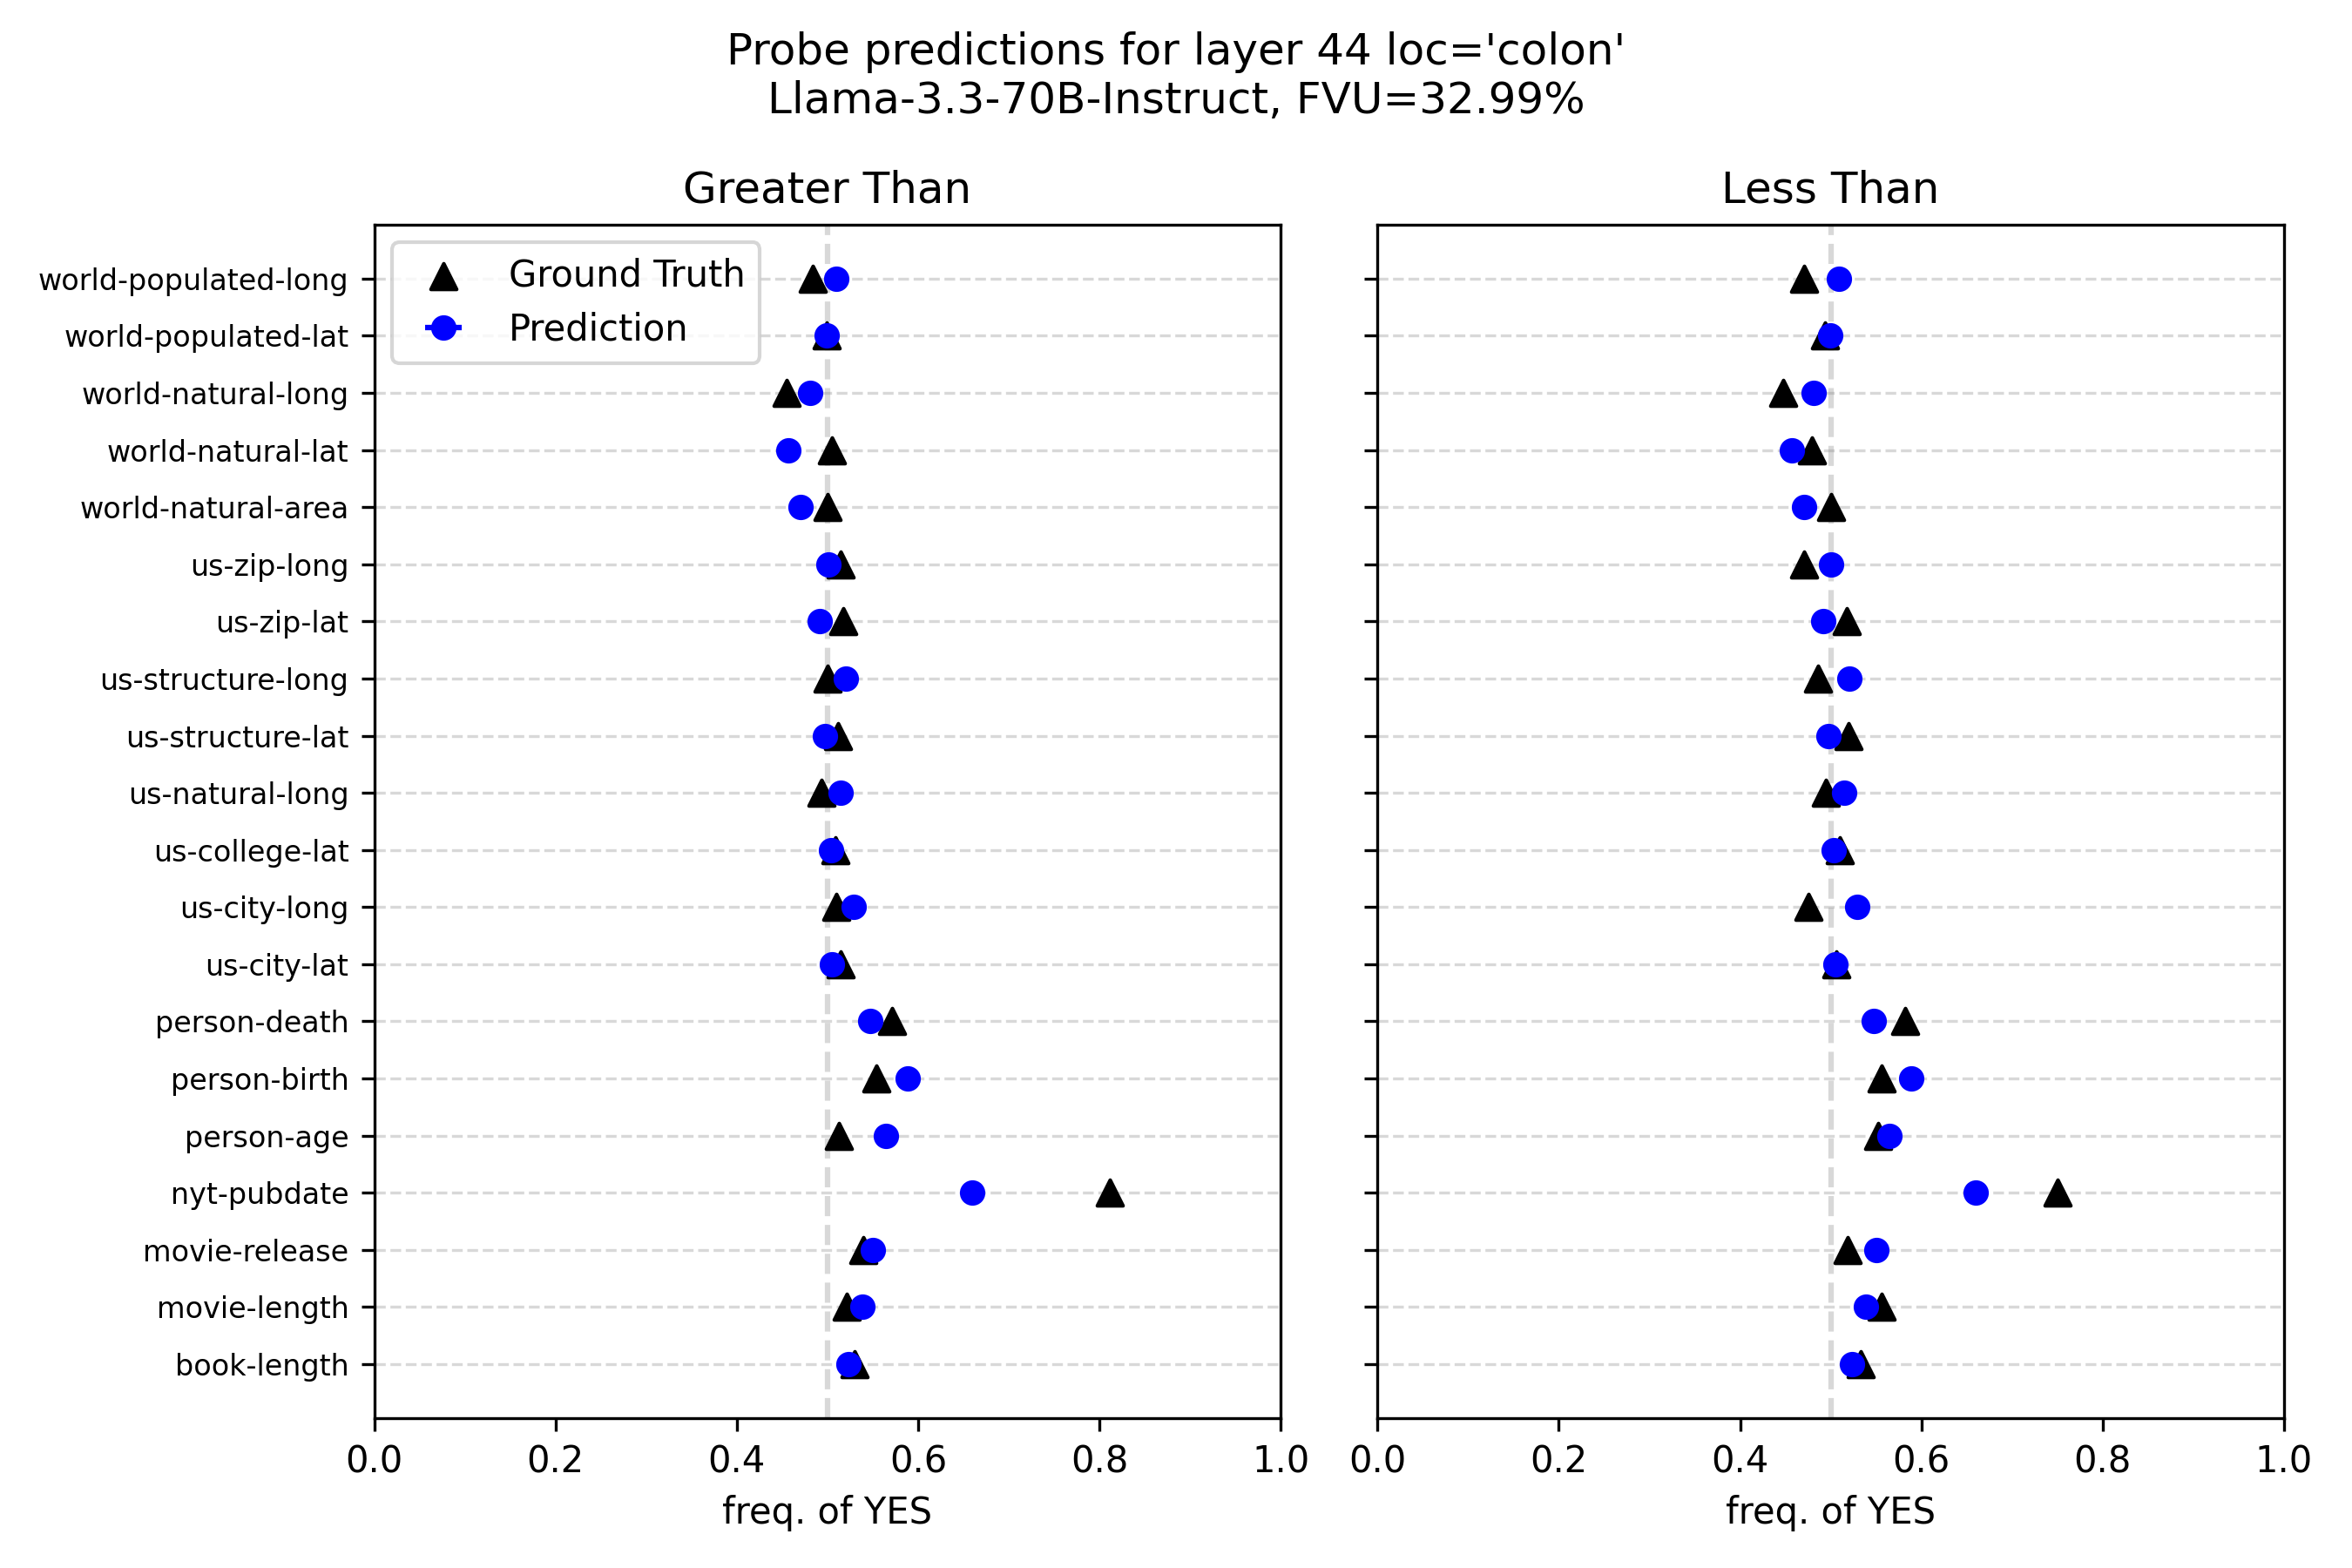
The image compares ground truth (black triangles) and model predictions (blue circles) for 16 categorical attributes across two sections: "Greater Than" (left) and "Less Than" (right). The x-axis represents the frequency of "YES" responses (0–1), while the y-axis lists attributes like "world-populated-long" and "book-length." The model (Llama-3.3-70B-Instruct) has a False Value Uncertainty (FVU) of 32.99%.
### Components/Axes
- **Title**: "Probe predictions for layer 44 loc='colon' Llama-3.3-70B-Instruct, FVU=32.99%"
- **X-axis**: "freq. of YES" (0.0 to 1.0)
- **Y-axis**: Attributes (e.g., "world-populated-long," "us-natural-long," "person-age")
- **Legend**:
- Black triangles: Ground Truth
- Blue circles: Prediction
- **Sections**:
- Left: "Greater Than" (ground truth > prediction)
- Right: "Less Than" (ground truth < prediction)
### Detailed Analysis
#### "Greater Than" Section (Left)
- **world-populated-long**: Ground truth (0.85), Prediction (0.75)
- **world-populated-lat**: Ground truth (0.78), Prediction (0.70)
- **world-natural-long**: Ground truth (0.72), Prediction (0.65)
- **world-natural-lat**: Ground truth (0.68), Prediction (0.60)
- **world-natural-area**: Ground truth (0.62), Prediction (0.55)
- **us-zip-long**: Ground truth (0.58), Prediction (0.50)
- **us-zip-lat**: Ground truth (0.55), Prediction (0.48)
- **us-structure-long**: Ground truth (0.50), Prediction (0.45)
- **us-structure-lat**: Ground truth (0.47), Prediction (0.42)
- **us-natural-long**: Ground truth (0.43), Prediction (0.38)
- **us-college-lat**: Ground truth (0.35), Prediction (0.30)
- **us-city-long**: Ground truth (0.30), Prediction (0.25)
- **us-city-lat**: Ground truth (0.28), Prediction (0.22)
- **person-death**: Ground truth (0.25), Prediction (0.20)
- **person-birth**: Ground truth (0.22), Prediction (0.18)
- **person-age**: Ground truth (0.15), Prediction (0.12)
- **nyt-pubdate**: Ground truth (0.08), Prediction (0.05)
#### "Less Than" Section (Right)
- **world-populated-long**: Ground truth (0.75), Prediction (0.80)
- **world-populated-lat**: Ground truth (0.70), Prediction (0.72)
- **world-natural-long**: Ground truth (0.65), Prediction (0.68)
- **world-natural-lat**: Ground truth (0.60), Prediction (0.62)
- **world-natural-area**: Ground truth (0.55), Prediction (0.57)
- **us-zip-long**: Ground truth (0.50), Prediction (0.52)
- **us-zip-lat**: Ground truth (0.48), Prediction (0.49)
- **us-structure-long**: Ground truth (0.45), Prediction (0.47)
- **us-structure-lat**: Ground truth (0.42), Prediction (0.43)
- **us-natural-long**: Ground truth (0.38), Prediction (0.40)
- **us-college-lat**: Ground truth (0.30), Prediction (0.32)
- **us-city-long**: Ground truth (0.25), Prediction (0.27)
- **us-city-lat**: Ground truth (0.22), Prediction (0.24)
- **person-death**: Ground truth (0.20), Prediction (0.22)
- **person-birth**: Ground truth (0.18), Prediction (0.20)
- **person-age**: Ground truth (0.12), Prediction (0.15)
- **nyt-pubdate**: Ground truth (0.05), Prediction (0.08)
- **movie-release**: Ground truth (0.07), Prediction (0.09)
- **movie-length**: Ground truth (0.06), Prediction (0.08)
- **book-length**: Ground truth (0.05), Prediction (0.07)
### Key Observations
1. **Directional Bias**:
- In "Greater Than," ground truth consistently exceeds predictions (e.g., "world-populated-long" by ~0.10).
- In "Less Than," predictions exceed ground truth (e.g., "book-length" by ~0.02).
2. **FVU Impact**: The 32.99% FVU suggests moderate uncertainty, with larger discrepancies in high-frequency categories (e.g., "world-populated-long").
3. **Outliers**:
- "nyt-pubdate" and "movie-release" show the largest gaps (0.03–0.05) in both sections.
- "person-age" and "book-length" have smaller discrepancies (<0.03).
### Interpretation
The model underestimates high-frequency attributes (e.g., "world-populated-long") and overestimates low-frequency ones (e.g., "book-length"). This suggests the model struggles with rare events but performs better for common categories. The FVU metric highlights systematic errors, indicating potential improvements in calibration for extreme frequency ranges. The split visualization aids in diagnosing directional bias, which could inform targeted retraining or feature engineering.