## Technical Description of Scatter Plots
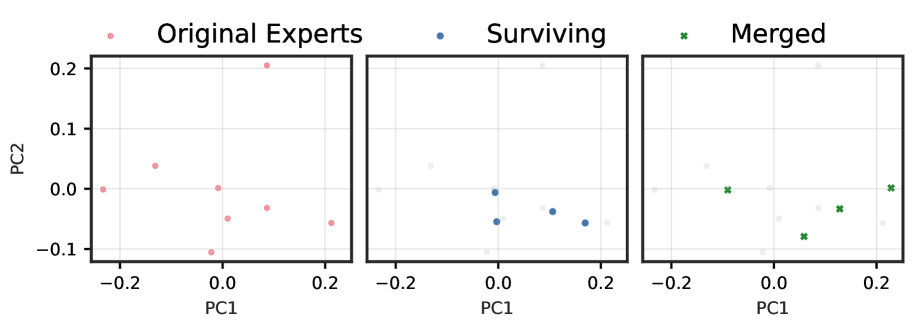
This image presents a series of three scatter plots arranged horizontally, sharing common axes and a legend. The plots visualize data points in a two-dimensional space defined by principal components.
### Legend and Axes
* **Legend:** Located at the top of the figure, the legend defines three categories of data points:
* **Original Experts:** Represented by red circles.
* **Surviving:** Represented by blue circles.
* **Merged:** Represented by green 'x' markers.
* **Y-axis:** The vertical axis is labeled "PC2". It has major tick marks and labels at -0.1, 0.0, 0.1, and 0.2.
* **X-axis:** The horizontal axis for each of the three plots is labeled "PC1". It has major tick marks and labels at -0.2, 0.0, and 0.2.
* **Grid:** A faint grid is present in all three plots, corresponding to the major tick marks on both axes.
### Plot 1: Original Experts (Left)
This plot displays the distribution of the "Original Experts" data points.
* **Title:** The plot is implicitly titled "Original Experts" based on the legend and the data points shown.
* **Data Points:** The plot contains 8 red circles representing the "Original Experts". Their approximate coordinates (PC1, PC2) are:
* (-0.23, 0.00)
* (-0.13, 0.04)
* (-0.02, -0.11)
* (-0.01, 0.00)
* (0.01, -0.05)
* (0.08, 0.21)
* (0.09, -0.03)
* (0.21, -0.06)
### Plot 2: Surviving (Middle)
This plot highlights the "Surviving" data points.
* **Title:** The plot is implicitly titled "Surviving".
* **Data Points:** The plot shows 4 blue circles representing the "Surviving" experts. Faint grey circles are also visible, showing the positions of the other "Original Experts" for context. The approximate coordinates (PC1, PC2) of the blue "Surviving" points are:
* (-0.01, -0.01)
* (0.00, -0.06)
* (0.11, -0.04)
* (0.17, -0.06)
### Plot 3: Merged (Right)
This plot highlights the "Merged" data points.
* **Title:** The plot is implicitly titled "Merged".
* **Data Points:** The plot shows 4 green 'x' markers representing the "Merged" experts. Faint grey circles are also visible, showing the positions of the "Original Experts" for context. The approximate coordinates (PC1, PC2) of the green "Merged" points are:
* (-0.09, 0.00)
* (0.06, -0.08)
* (0.13, -0.03)
* (0.23, 0.00)