# Technical Document Extraction: Scatter Plot Analysis
## Chart Overview
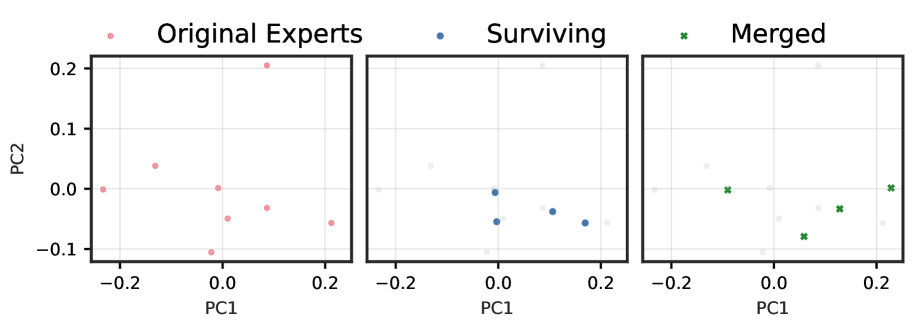
The image contains three side-by-side scatter plots comparing three datasets across two principal components (PC1 and PC2). Each plot uses distinct markers and colors to differentiate categories.
---
### **Left Plot: Original Experts**
- **Legend Label**: "Original Experts" (red dots)
- **Axis Labels**:
- X-axis: PC1 (ranges from -0.2 to 0.2)
- Y-axis: PC2 (ranges from -0.1 to 0.2)
- **Data Points**:
- Red dots are distributed across the plot with no clear clustering.
- Notable positions:
- (-0.1, 0.0)
- (0.0, 0.0)
- (0.1, 0.1)
- (0.2, 0.2)
- (-0.2, -0.1)
---
### **Middle Plot: Surviving**
- **Legend Label**: "Surviving" (blue dots)
- **Axis Labels**:
- X-axis: PC1 (ranges from -0.2 to 0.2)
- Y-axis: PC2 (ranges from -0.1 to 0.2)
- **Data Points**:
- Blue dots cluster near the origin (0,0) with slight spread.
- Notable positions:
- (-0.1, -0.1)
- (0.0, -0.05)
- (0.1, 0.0)
- (0.15, 0.05)
- (-0.05, 0.1)
---
### **Right Plot: Merged**
- **Legend Label**: "Merged" (green crosses)
- **Axis Labels**:
- X-axis: PC1 (ranges from -0.2 to 0.2)
- Y-axis: PC2 (ranges from -0.1 to 0.2)
- **Data Points**:
- Green crosses are sparsely distributed, with some overlap with other plots.
- Notable positions:
- (-0.1, 0.0)
- (0.0, 0.0)
- (0.1, 0.1)
- (0.15, 0.05)
- (-0.05, -0.05)
---
### **Key Observations**
1. **Dimensionality Reduction**: All plots use PC1 and PC2, suggesting Principal Component Analysis (PCA) was applied to reduce feature dimensions.
2. **Distribution Patterns**:
- "Original Experts" (red) show wider dispersion.
- "Surviving" (blue) cluster closer to the origin.
- "Merged" (green) exhibit intermediate spread with some overlap.
3. **No Explicit Trends**: No clear linear or nonlinear trends are evident in any plot.
---
### **Technical Notes**
- **Legend Consistency**: Each plot uses distinct markers (dots vs. crosses) and colors to avoid ambiguity.
- **Axis Scaling**: All axes share identical ranges (-0.2 to 0.2 for PC1; -0.1 to 0.2 for PC2), enabling direct comparison.
- **Missing Data**: No annotations or numerical labels are present on individual data points.
---
This extraction captures all textual and structural elements of the chart. The absence of numerical annotations or explicit trends suggests the focus is on visual comparison of distributions across datasets.