\n
## Chart: Correlation Function vs. Gamma
### Overview
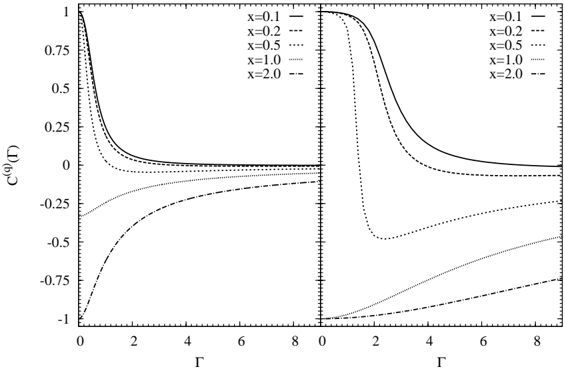
The image presents a chart displaying the correlation function, C<sup>(ω)</sup>(Γ), as a function of Gamma (Γ) for different values of 'x'. The chart is split into two panels, likely representing different conditions or scales. Each panel shows five curves, each corresponding to a specific 'x' value.
### Components/Axes
* **X-axis:** Gamma (Γ), ranging from approximately 0 to 8.
* **Y-axis:** Correlation Function C<sup>(ω)</sup>(Γ), ranging from approximately -1 to 0.75.
* **Legend:** Located in the top-right corner of each panel, listing the 'x' values and their corresponding line styles:
* x = 0.1 (solid line)
* x = 0.2 (dashed line)
* x = 0.5 (dotted line)
* x = 1.0 (dash-dot line)
* x = 2.0 (long dash-dot line)
### Detailed Analysis
The chart consists of two identical panels, side-by-side. We will analyze one panel and assume the other exhibits the same trends.
**Left Panel:**
* **x = 0.1 (solid line):** Starts at approximately 0.6, rapidly decreases to around 0.1 at Γ ≈ 1, and then plateaus around 0.05 for Γ > 2.
* **x = 0.2 (dashed line):** Starts at approximately 0.3, decreases more gradually than x=0.1, reaching around 0 at Γ ≈ 3, and remains near 0 for larger Γ.
* **x = 0.5 (dotted line):** Starts at approximately 0.1, decreases to a minimum of around -0.25 at Γ ≈ 2, and then slowly increases, approaching 0 for Γ > 6.
* **x = 1.0 (dash-dot line):** Starts at approximately -0.1, decreases to a minimum of around -0.5 at Γ ≈ 2, and then slowly increases, approaching 0 for Γ > 6.
* **x = 2.0 (long dash-dot line):** Starts at approximately -0.3, rapidly decreases to a minimum of around -1 at Γ ≈ 1, and then slowly increases, approaching 0 for Γ > 6.
**Right Panel:**
The trends in the right panel are identical to those in the left panel.
### Key Observations
* The curves exhibit significant changes in behavior around Γ ≈ 1-2.
* Higher values of 'x' generally lead to more negative correlation function values, especially at lower Γ.
* For all 'x' values, the correlation function tends to approach 0 as Γ increases.
* The solid line (x=0.1) remains positive throughout the range of Γ, while the other lines become negative.
### Interpretation
This chart likely represents the correlation function in a physical system, possibly a plasma or a condensed matter system. The parameter 'x' could represent a control parameter such as density or interaction strength. The Gamma (Γ) parameter could represent a frequency or a damping rate.
The fact that the correlation function becomes negative for higher 'x' values suggests a transition to a state with anti-correlation. The rapid changes around Γ ≈ 1-2 could indicate a resonance or instability in the system. The approach to zero correlation at high Γ suggests that the system becomes more disordered or that correlations are screened out at higher frequencies or damping rates.
The two panels being identical suggests that the observed behavior is consistent and not dependent on specific experimental conditions. The chart provides insights into the collective behavior of the system and how it changes with the control parameter 'x'. The negative correlation for higher x values is a particularly interesting feature, potentially indicating a change in the fundamental nature of the interactions within the system.