## Line Graph: Behavior of C^(q)(Γ) Across Γ Values for Different x Parameters
### Overview
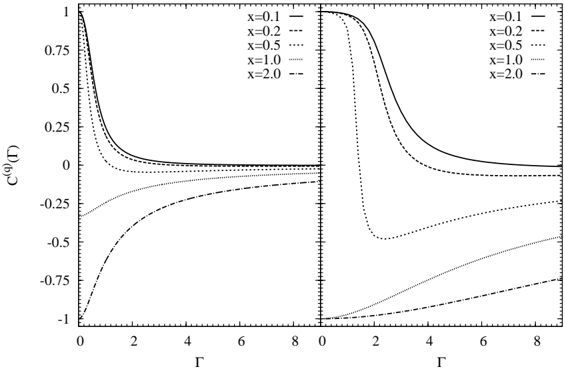
The image contains two mirrored line graphs side-by-side, depicting the relationship between Γ (horizontal axis) and C^(q)(Γ) (vertical axis) for five distinct x values (0.1, 0.2, 0.5, 1.0, 2.0). The left graph spans Γ = 0 to 8, while the right graph spans Γ = -8 to 0. Each x value is represented by a unique line style (solid, dashed, dotted, etc.), with curves showing distinct trends in C^(q)(Γ) as Γ varies.
---
### Components/Axes
- **Left Graph (Γ ≥ 0):**
- **X-axis (Γ):** Labeled Γ, ranging from 0 to 8 in increments of 2.
- **Y-axis (C^(q)(Γ)):** Labeled C^(q)(Γ), ranging from -1 to 1 in increments of 0.25.
- **Legend:** Positioned at the top-left, associating line styles with x values:
- x=0.1: Solid line
- x=0.2: Dashed line
- x=0.5: Dotted line
- x=1.0: Dash-dot line
- x=2.0: Double-dash line
- **Right Graph (Γ ≤ 0):**
- **X-axis (Γ):** Labeled Γ, ranging from -8 to 0 in increments of 2.
- **Y-axis (C^(q)(Γ)):** Same scale as the left graph (-1 to 1).
- **Legend:** Positioned at the top-right, mirroring the left graph's legend.
---
### Detailed Analysis
#### Left Graph (Γ ≥ 0)
1. **x=0.1 (Solid Line):**
- Starts near 1 at Γ=0, sharply declines to ~0.25 by Γ=2, then plateaus.
- **Key Trend:** Rapid initial decay followed by stabilization.
2. **x=0.2 (Dashed Line):**
- Begins at ~0.75, declines gradually to ~0.1 by Γ=4, then flattens.
- **Key Trend:** Slower decay than x=0.1, with a longer plateau.
3. **x=0.5 (Dotted Line):**
- Starts at ~0.5, declines to ~-0.25 by Γ=6, then rises slightly.
- **Key Trend:** Crosses into negative territory before stabilizing.
4. **x=1.0 (Dash-Dot Line):**
- Begins at ~0.25, declines to ~-0.75 by Γ=4, then sharply rises to ~-0.25 by Γ=8.
- **Key Trend:** Strong negative dip followed by recovery.
5. **x=2.0 (Double-Dash Line):**
- Starts at ~-0.5, declines to ~-0.9 by Γ=2, then rises to ~-0.5 by Γ=8.
- **Key Trend:** Initial sharp drop followed by partial recovery.
#### Right Graph (Γ ≤ 0)
1. **x=0.1 (Solid Line):**
- Starts near -1 at Γ=-8, rises to ~-0.25 by Γ=-2, then plateaus.
- **Key Trend:** Gradual ascent from a deep negative value.
2. **x=0.2 (Dashed Line):**
- Begins at ~-0.75, rises to ~-0.1 by Γ=-4, then flattens.
- **Key Trend:** Moderate recovery from negative values.
3. **x=0.5 (Dotted Line):**
- Starts at ~-0.5, rises to ~0.25 by Γ=-6, then dips slightly.
- **Key Trend:** Crosses into positive territory before stabilizing.
4. **x=1.0 (Dash-Dot Line):**
- Begins at ~0.25, rises to ~0.75 by Γ=-4, then sharply drops to ~0.25 by Γ=0.
- **Key Trend:** Sharp positive peak followed by decline.
5. **x=2.0 (Double-Dash Line):**
- Starts at ~-0.5, rises to ~0.5 by Γ=-2, then drops to ~-0.5 by Γ=0.
- **Key Trend:** Symmetric V-shaped curve.
---
### Key Observations
1. **Symmetry:** The right graph mirrors the left graph's behavior but with inverted Γ values (e.g., x=0.1's solid line on the left peaks at Γ=0, while on the right it starts at Γ=-8).
2. **x-Dependent Behavior:**
- Lower x values (0.1–0.5) exhibit smoother transitions.
- Higher x values (1.0–2.0) show sharper inflection points and greater amplitude swings.
3. **Asymptotic Behavior:** All curves approach horizontal asymptotes as |Γ| increases, suggesting saturation effects.
4. **Negative Γ Dominance:** For x ≥ 1.0, the right graph (Γ ≤ 0) shows more pronounced oscillations compared to the left graph.
---
### Interpretation
The data suggests that C^(q)(Γ) is highly sensitive to both Γ and x parameters. The mirrored symmetry implies a potential relationship where positive and negative Γ values exhibit complementary behaviors for a given x. The sharp transitions at intermediate Γ values (e.g., x=1.0 and x=2.0) may indicate threshold effects or phase changes in the system being modeled. The flattening of curves at extreme Γ values suggests diminishing returns or saturation limits. This could represent phenomena such as signal attenuation, material stress responses, or thermodynamic equilibria, depending on the context of the original study.