TECHNICAL ASSET FINGERPRINT
f82e0b5aa83c82059c985c7b
Click to view fullscreen
Press ESC or click to close
FOUND IN PAPERS
EXPERT: healer-alpha-free VERSION 1
RUNTIME: free/openrouter/healer-alpha
INTEL_VERIFIED
## Screenshot: Imandra Notebook - Region Decomposition for Exchange Pricing
### Overview
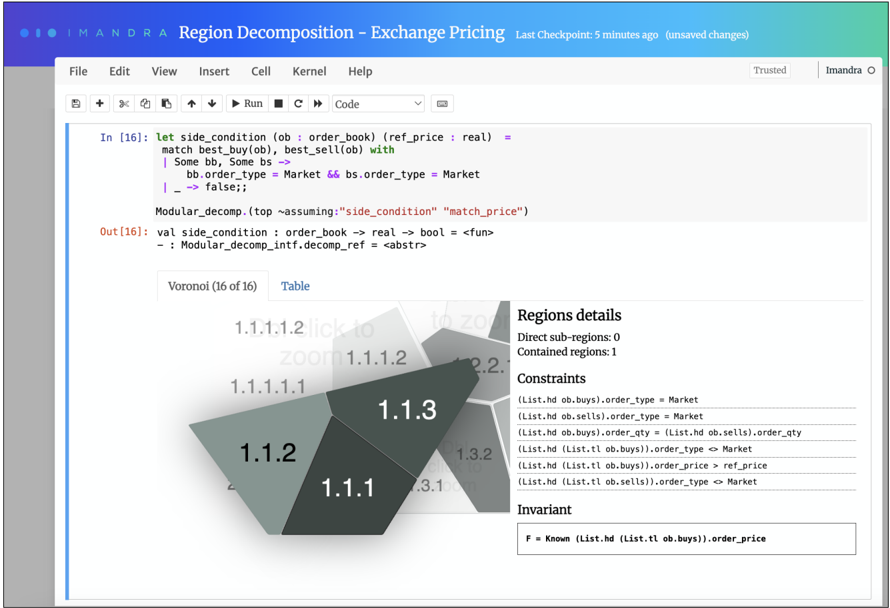
This image is a screenshot of a computational notebook interface (likely Jupyter or similar) running the Imandra formal verification platform. The notebook is titled "Region Decomposition - Exchange Pricing" and shows a code cell defining a logical condition for an order book, followed by a visualization of the resulting decomposition into hierarchical regions. The interface includes standard menu bars, a code cell with OCaml-like syntax, and an interactive visualization panel with a Voronoi diagram and detailed textual information.
### Components/Axes
**Header Bar:**
- **Title:** "IMANDRA Region Decomposition - Exchange Pricing"
- **Status:** "Last Checkpoint: 5 minutes ago (unsaved changes)"
- **Menu Bar:** File, Edit, View, Insert, Cell, Kernel, Help
- **Toolbar:** Standard notebook icons (save, cut, copy, paste, run, etc.)
- **Kernel Indicator:** "Trusted" and "Imandra" logo (top-right)
**Code Cell (In [16]):**
- **Language:** OCaml-like syntax.
- **Content:** Defines a function `side_condition` and calls `Modular_decomp`.
- **Output (Out [16]):** Shows the function signature and a reference to a decomposition interface.
**Visualization Panel:**
- **Tab Selection:** "Voronoi (16 of 16)" is active; "Table" tab is inactive.
- **Main Diagram:** A Voronoi tessellation (a type of spatial partition) with numbered, irregular polygonal regions. Regions are shaded in varying tones of gray.
- **Interactive Prompt:** Faint text overlay reads "Click to zoom".
- **Right-Side Details Panel:**
- **Header:** "Regions details"
- **Sub-region Count:** "Direct sub-regions: 0", "Contained regions: 1"
- **Constraints Section:** A list of logical constraints.
- **Invariant Section:** A single invariant formula.
### Detailed Analysis
**1. Code Cell Content:**
The code defines a predicate `side_condition` on an `order_book` (`ob`) and a reference price (`ref_price`). It pattern matches on the best buy (`bb`) and best sell (`bs`) orders from the book. The condition is `true` only if both the best buy and best sell orders are of type `Market`. Otherwise, it returns `false`.
The subsequent call is:
`Modular_decomp.(top ~assuming:"side_condition" "match_price")`
This instructs Imandra to perform a modular decomposition of the space defined by the `match_price` function, assuming the `side_condition` holds.
**2. Output Cell Content:**
- `val side_condition : order_book -> real -> bool = <fun>`: Confirms the function type.
- `- : Modular_decomp_intf.decomp_ref = <abstr>`: Returns an abstract reference to the computed decomposition.
**3. Visualization - Voronoi Diagram:**
The diagram partitions a 2D space into 16 regions (as indicated by "16 of 16"). The visible regions are labeled with hierarchical numbers. The largest, central regions are:
- **1.1.1** (Darkest gray, bottom-center)
- **1.1.2** (Medium-dark gray, left of 1.1.1)
- **1.1.3** (Medium gray, above and right of 1.1.1)
- **1.1.1.1** (Lighter gray, left of 1.1.2)
- **1.1.1.2** (Light gray, top-left)
- **1.2.2** (Light gray, top-right)
- **1.3.2** (Light gray, right side)
- **1.3.1** (Medium-light gray, bottom-right)
The numbering suggests a tree-like hierarchy (e.g., region 1.1 contains sub-regions 1.1.1, 1.1.2, 1.1.3).
**4. Details Panel - Constraints:**
The panel displays the logical constraints defining the currently selected region (likely region 1.1.1, given its prominence). The constraints are:
1. `(List.hd ob.buys).order_type = Market`
2. `(List.hd ob.sells).order_type = Market`
3. `(List.hd ob.buys).order_qty = (List.hd ob.sells).order_qty`
4. `(List.hd (List.tl ob.buys)).order_type <> Market`
5. `(List.hd (List.tl ob.buys)).order_price > ref_price`
6. `(List.hd (List.tl ob.sells)).order_type <> Market`
**5. Details Panel - Invariant:**
- `F = Known (List.hd (List.tl ob.buys)).order_price`
### Key Observations
- **Hierarchical Decomposition:** The region numbering (1.1, 1.1.1, 1.1.1.1) clearly indicates a nested, hierarchical structure of the state space for the order book model.
- **Constraint Specificity:** The displayed constraints for the selected region are highly specific. They define a scenario where the top buy and sell orders are matching Market orders of equal quantity, while the *next* orders in the book are *not* Market orders, and the next buy order's price is above the reference price.
- **Visual Encoding:** Region importance or size is likely encoded by both area and shade. The largest, most central regions (1.1.1, 1.1.2, 1.1.3) are the darkest, suggesting they represent more fundamental or probable states of the system.
- **Interface State:** The notebook has "unsaved changes," indicating active analysis. The visualization is on the 16th of 16 possible views or decompositions.
### Interpretation
This screenshot captures a moment in a formal verification or analysis session for an exchange pricing algorithm. The user is employing Imandra's **modular decomposition** feature to automatically partition the complex state space of an order book into logically distinct regions based on the `side_condition` (which requires the top-of-book to be a Market order match).
The **purpose** is to reason about the system's behavior in a structured way. Instead of analyzing the entire, continuous state space, Imandra breaks it into finitely many regions (like 1.1.1), each characterized by a set of concrete constraints. The invariant `F` suggests that within this specific region, the price of the second-best buy order is a known, fixed value, which is a powerful property for verification.
The **relationship** between elements is causal: the code defines the logical assumption (`side_condition`), which drives the decomposition algorithm, which in turn generates the visual map (Voronoi diagram) and the detailed logical descriptions (constraints). The diagram provides an intuitive, spatial map of the system's possible states, while the text panel provides the rigorous logical definition needed for proof.
A **notable pattern** is the correlation between a region's position/size in the diagram and the generality of its constraints. The large, central regions likely correspond to common, core market scenarios (like a clean match at the top of the book), while the smaller, peripheral regions (e.g., 1.1.1.2) represent more specific, edge-case conditions involving the state of deeper orders in the book. This decomposition allows engineers to verify properties of the pricing algorithm on each class of behavior separately.
DECODING INTELLIGENCE...