## Line Chart: Model Accuracy on Math Problems
### Overview
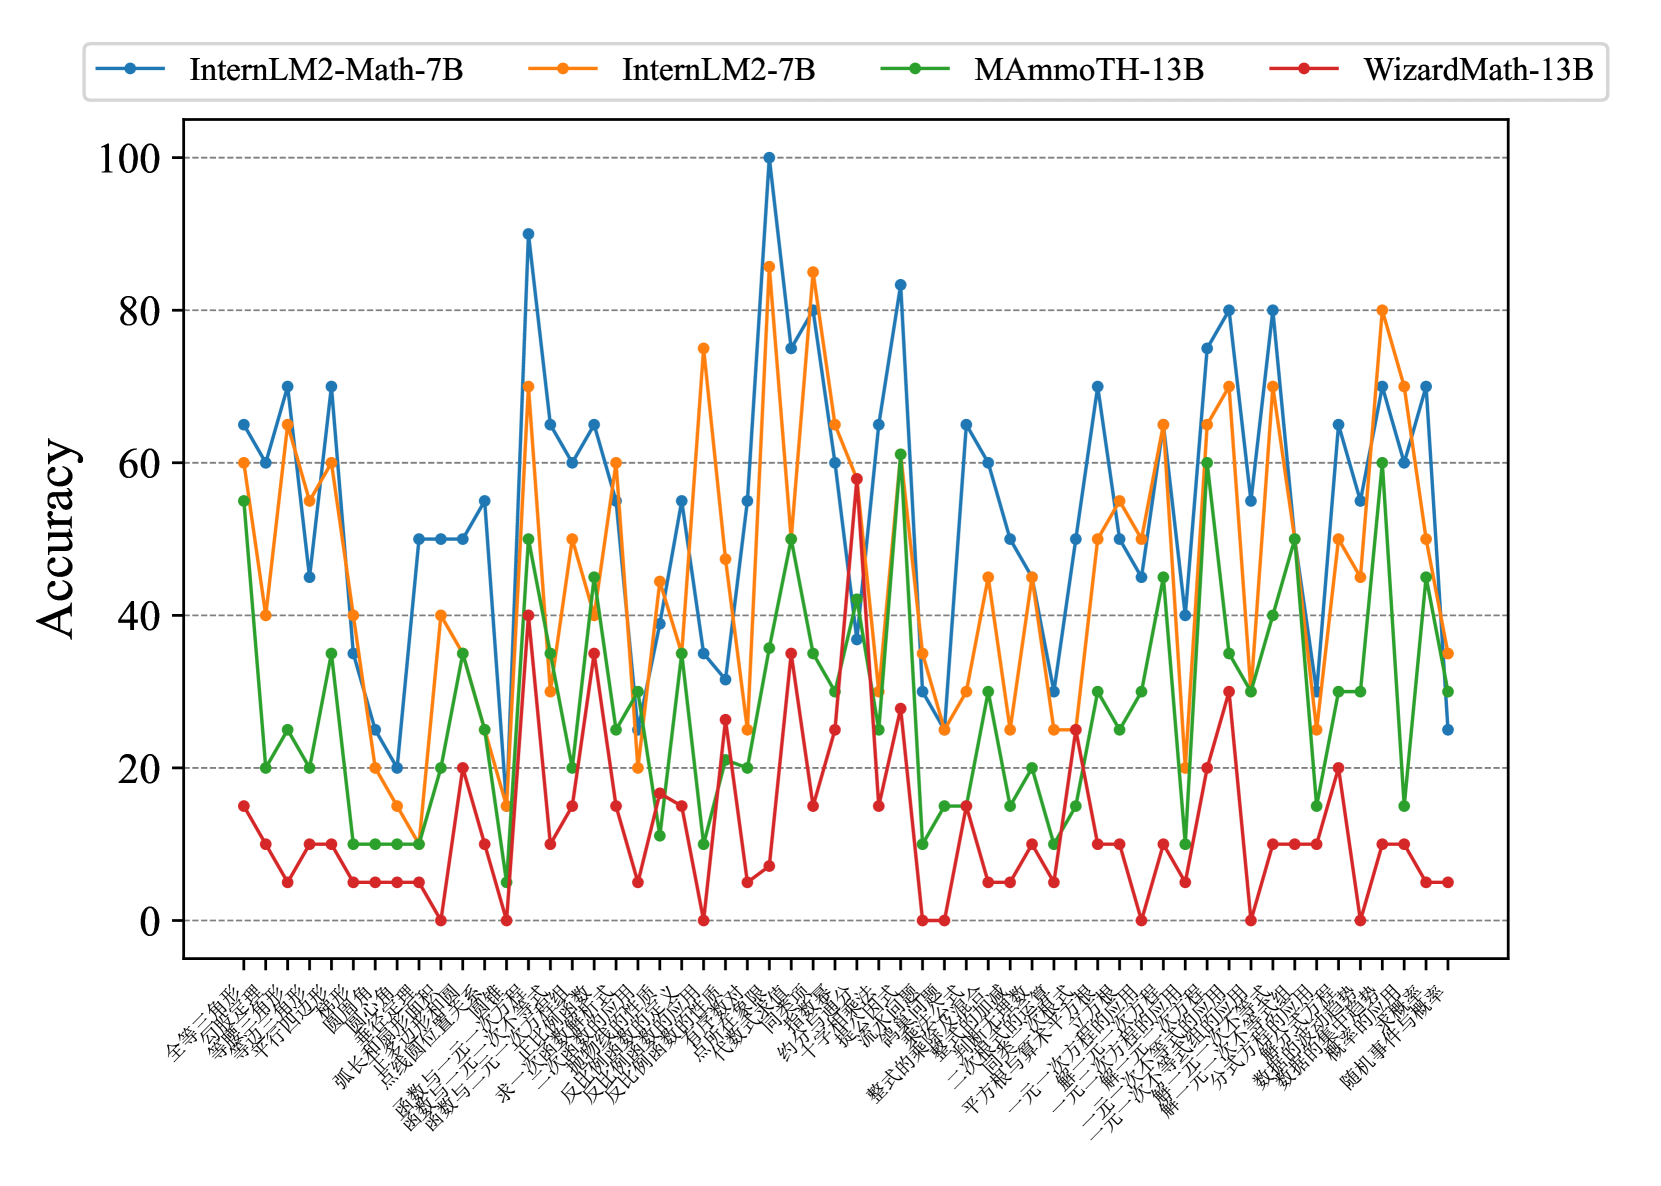
The image is a line chart comparing the accuracy of four different language models (InternLM2-Math-7B, InternLM2-7B, MAmmoTH-13B, and WizardMath-13B) on a series of math problems. The x-axis represents different math problem types (in Chinese), and the y-axis represents the accuracy score.
### Components/Axes
* **Title:** None explicitly present in the image.
* **X-axis:** Represents different math problem types, labeled in Chinese. The labels are closely spaced and difficult to read completely, but some visible labels include: "全等三角形" (Congruent Triangles), "等腰三角形" (Isosceles Triangle), "平方根" (Square Root), "函数与一次函数" (Function and Linear Function), "求一次函数" (Find Linear Function), "随机事件与概率" (Random Events and Probability).
* **Y-axis:** Represents Accuracy, ranging from 0 to 100 in increments of 20. Horizontal grid lines are present at each increment.
* **Legend:** Located at the top of the chart.
* Blue line: InternLM2-Math-7B
* Orange line: InternLM2-7B
* Green line: MAmmoTH-13B
* Red line: WizardMath-13B
### Detailed Analysis
The chart displays the accuracy of each model across different math problem types. The x-axis labels are in Chinese, and the models are compared based on their accuracy scores.
Here's a breakdown of the trends for each model:
* **InternLM2-Math-7B (Blue):** This model generally performs well, with accuracy fluctuating between approximately 40 and 100. It shows a peak in accuracy around the middle of the x-axis.
* Approximate data points: Starts around 70, dips to 45, rises to 70, drops to 50, fluctuates around 50-70, reaches a peak of 100, then varies between 30 and 80 towards the end.
* **InternLM2-7B (Orange):** This model also shows variable performance, with accuracy ranging from approximately 20 to 90.
* Approximate data points: Starts around 60, drops to 40, rises to 60, fluctuates around 40-50, reaches peaks around 75 and 85, then varies between 20 and 80.
* **MAmmoTH-13B (Green):** This model generally has lower accuracy compared to the other two, with scores mostly between 0 and 60.
* Approximate data points: Starts around 25, peaks around 35, then fluctuates between 0 and 40, with a few peaks around 50-60.
* **WizardMath-13B (Red):** This model consistently shows the lowest accuracy, with scores mostly below 40 and often near 0.
* Approximate data points: Starts around 15, fluctuates between 0 and 20, with occasional peaks around 30-40.
Here are some of the Chinese labels transcribed with English translations:
* 全等三角形 (quán děng sān jiǎo xíng): Congruent Triangles
* 等腰三角形 (děng yāo sān jiǎo xíng): Isosceles Triangle
* 平方根 (píng fāng gēn): Square Root
* 函数与一次函数 (hán shù yǔ yī cì hán shù): Function and Linear Function
* 求一次函数 (qiú yī cì hán shù): Find Linear Function
* 随机事件与概率 (suí jī shì jiàn yǔ gài lǜ): Random Events and Probability
### Key Observations
* InternLM2-Math-7B and InternLM2-7B generally outperform MAmmoTH-13B and WizardMath-13B.
* WizardMath-13B consistently has the lowest accuracy across all problem types.
* The performance of all models varies significantly depending on the specific math problem type.
* There are some problem types where all models perform poorly (accuracy close to 0).
* There are some problem types where InternLM2-Math-7B and InternLM2-7B perform exceptionally well (accuracy close to 100).
### Interpretation
The chart provides a comparative analysis of the accuracy of four language models on a range of math problems. The results suggest that InternLM2-Math-7B and InternLM2-7B are generally more proficient in solving these problems compared to MAmmoTH-13B and WizardMath-13B. However, the performance of all models is highly dependent on the specific type of math problem. The consistent low accuracy of WizardMath-13B indicates a potential weakness in its mathematical reasoning capabilities. The fluctuations in accuracy across different problem types highlight the varying difficulty levels and the models' specific strengths and weaknesses. Further investigation into the types of problems where each model excels or struggles could provide valuable insights for model improvement.