\n
## Line Chart: Attack Success Rate (ASR) vs. Attack Ratio for Federated Learning Defenses
### Overview
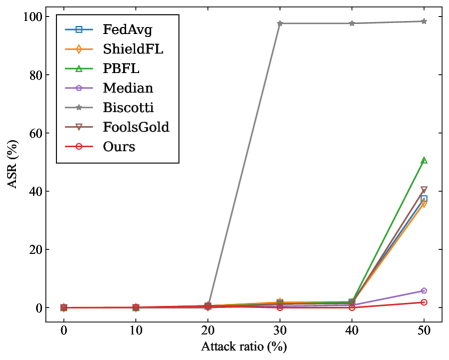
This image presents a line chart comparing the Attack Success Rate (ASR) of various federated learning defense mechanisms against increasing attack ratios. The chart visualizes how effectively each defense strategy mitigates attacks as the proportion of malicious participants grows.
### Components/Axes
* **X-axis:** "Attack ratio (%)" - Ranges from 0% to 50%, with markers at 0, 10, 20, 30, 40, and 50.
* **Y-axis:** "ASR (%)" - Ranges from 0% to 100%, with markers at 0, 20, 40, 60, 80, and 100.
* **Legend (Top-Left):** Lists the different defense mechanisms being compared:
* FedAvg (Blue, dashed line with square markers)
* ShieldFL (Orange, dashed line with circle markers)
* PBFL (Green, dashed line with triangle markers)
* Median (Gray, solid line with star markers)
* Biscotti (Brown, solid line with diamond markers)
* FoolsGold (Purple, dashed line with inverted triangle markers)
* Ours (Red, solid line with circle markers)
### Detailed Analysis
Let's analyze each line's trend and extract approximate data points.
* **FedAvg (Blue):** The line remains relatively flat from 0% to 20% attack ratio, around 0-5% ASR. It then sharply increases from 20% to 50%, reaching approximately 40% ASR at 50%.
* (0%, ~2%)
* (10%, ~3%)
* (20%, ~5%)
* (30%, ~10%)
* (40%, ~25%)
* (50%, ~40%)
* **ShieldFL (Orange):** Similar to FedAvg, it stays low (0-5% ASR) until 20% attack ratio. It then increases more gradually, reaching approximately 35% ASR at 50%.
* (0%, ~1%)
* (10%, ~2%)
* (20%, ~3%)
* (30%, ~10%)
* (40%, ~25%)
* (50%, ~35%)
* **PBFL (Green):** Remains very low (0-2% ASR) until 40% attack ratio. It then experiences a steep increase, reaching approximately 50% ASR at 50%.
* (0%, ~1%)
* (10%, ~1%)
* (20%, ~1%)
* (30%, ~2%)
* (40%, ~10%)
* (50%, ~50%)
* **Median (Gray):** Shows a consistent ASR of approximately 95% across all attack ratios.
* (0%, ~95%)
* (10%, ~95%)
* (20%, ~95%)
* (30%, ~95%)
* (40%, ~95%)
* (50%, ~95%)
* **Biscotti (Brown):** Maintains a low ASR (0-5%) up to 20% attack ratio. It then increases moderately, reaching approximately 20% ASR at 50%.
* (0%, ~1%)
* (10%, ~2%)
* (20%, ~3%)
* (30%, ~5%)
* (40%, ~10%)
* (50%, ~20%)
* **FoolsGold (Purple):** Similar to Biscotti, it stays low (0-5%) until 20%. It then increases, reaching approximately 30% ASR at 50%.
* (0%, ~1%)
* (10%, ~1%)
* (20%, ~2%)
* (30%, ~5%)
* (40%, ~15%)
* (50%, ~30%)
* **Ours (Red):** Remains consistently very low (0-2% ASR) across all attack ratios.
* (0%, ~1%)
* (10%, ~1%)
* (20%, ~1%)
* (30%, ~1%)
* (40%, ~2%)
* (50%, ~2%)
### Key Observations
* The "Median" defense consistently exhibits a very high ASR (around 95%), indicating it is highly vulnerable to attacks regardless of the attack ratio.
* The proposed defense ("Ours") demonstrates the lowest ASR across all attack ratios, suggesting it is the most robust against the tested attacks.
* FedAvg, ShieldFL, Biscotti, and FoolsGold show a gradual increase in ASR as the attack ratio increases, indicating some vulnerability.
* PBFL is very effective at low attack ratios but experiences a sharp increase in ASR at higher ratios.
### Interpretation
The chart demonstrates the effectiveness of different defense mechanisms in federated learning against adversarial attacks. The "Ours" defense stands out as significantly more resilient than the other methods tested, maintaining a low ASR even with a 50% attack ratio. The high ASR of the "Median" defense suggests it is not a viable option for secure federated learning. The varying performance of other defenses (FedAvg, ShieldFL, PBFL, Biscotti, FoolsGold) highlights the trade-offs between robustness and other factors like computational cost or communication overhead. The sharp increase in ASR for PBFL at higher attack ratios suggests it may be susceptible to specific attack strategies that exploit its vulnerabilities when a significant portion of participants are malicious. This data suggests that the proposed defense ("Ours") offers a substantial improvement in security for federated learning systems. The chart provides a clear visual comparison of the defenses, allowing for informed decision-making regarding security strategies in federated learning environments.