\n
## Line Chart: Federated Learning Backdoor Attack Success Rate (ASR) vs. Attack Ratio
### Overview
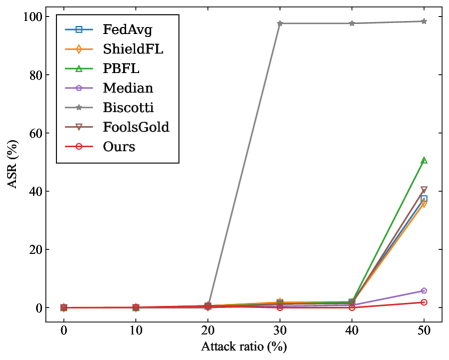
This is a line chart comparing the performance of seven different federated learning (FL) defense mechanisms against a backdoor attack. The chart plots the Attack Success Rate (ASR) on the y-axis against the Attack Ratio (the proportion of malicious clients) on the x-axis. The data demonstrates how the effectiveness of the attack (ASR) changes for each defense method as the attacker's presence in the network increases.
### Components/Axes
* **Chart Type:** Line chart with markers.
* **X-Axis:**
* **Label:** `Attack ratio (%)`
* **Scale:** Linear, from 0 to 50.
* **Markers/Ticks:** 0, 10, 20, 30, 40, 50.
* **Y-Axis:**
* **Label:** `ASR (%)` (Attack Success Rate)
* **Scale:** Linear, from 0 to 100.
* **Markers/Ticks:** 0, 20, 40, 60, 80, 100.
* **Legend:** Located in the top-left quadrant of the chart area. It lists seven data series with corresponding colors and marker symbols.
1. `FedAvg` - Blue line, square marker (□).
2. `ShieldFL` - Orange line, diamond marker (◇).
3. `PBFL` - Green line, upward-pointing triangle marker (△).
4. `Median` - Purple line, circle marker (○).
5. `Biscotti` - Gray line, asterisk marker (*).
6. `FoolsGold` - Brown line, downward-pointing triangle marker (▽).
7. `Ours` - Red line, pentagram marker (☆).
### Detailed Analysis
The chart shows the ASR for each method at attack ratios of 0%, 10%, 20%, 30%, 40%, and 50%.
**Trend Verification & Data Points (Approximate):**
1. **Biscotti (Gray, *):**
* **Trend:** Shows a sharp, near-vertical increase between 20% and 30% attack ratio, then plateaus at a very high ASR.
* **Points:** ~0% ASR at 0-20% attack ratio. Jumps to ~98% ASR at 30%. Remains at ~98% ASR at 40% and 50%.
2. **PBFL (Green, △):**
* **Trend:** Remains near zero until 40%, then exhibits a steep, linear increase.
* **Points:** ~0% ASR at 0-40%. Rises to ~50% ASR at 50%.
3. **FoolsGold (Brown, ▽):**
* **Trend:** Similar to PBFL but with a slightly lower final value.
* **Points:** ~0% ASR at 0-40%. Rises to ~40% ASR at 50%.
4. **ShieldFL (Orange, ◇):**
* **Trend:** Follows a similar upward trajectory to FoolsGold after 40%.
* **Points:** ~0% ASR at 0-40%. Rises to ~38% ASR at 50%.
5. **FedAvg (Blue, □):**
* **Trend:** Very similar to ShieldFL, nearly overlapping.
* **Points:** ~0% ASR at 0-40%. Rises to ~36% ASR at 50%.
6. **Median (Purple, ○):**
* **Trend:** Shows a very gradual, slight increase starting around 30%.
* **Points:** ~0% ASR at 0-20%. ~1% ASR at 30%. ~2% ASR at 40%. ~6% ASR at 50%.
7. **Ours (Red, ☆):**
* **Trend:** The most robust performance. The line remains almost perfectly flat and close to zero across the entire range.
* **Points:** ~0% ASR at all attack ratios from 0% to 50%.
### Key Observations
1. **Critical Threshold:** A clear performance divergence occurs for most methods between 40% and 50% attack ratio.
2. **Biscotti's Vulnerability:** The Biscotti method fails catastrophically at a 30% attack ratio, with ASR jumping to near 100%, indicating it is highly vulnerable once attackers reach a critical mass.
3. **Robustness Gradient:** At the highest tested attack ratio (50%), the methods rank in robustness (lowest to highest ASR) as: **Ours** (best) < Median < FedAvg ≈ ShieldFL < FoolsGold < PBFL < Biscotti (worst).
4. **"Ours" Superiority:** The proposed method ("Ours") maintains an ASR near 0% even when half the clients (50%) are malicious, significantly outperforming all other compared defenses.
### Interpretation
This chart is a comparative evaluation of resilience in federated learning systems. The **Attack Ratio** represents the threat level (percentage of malicious participants), and the **ASR** measures the success of the adversary's goal (e.g., causing the global model to misclassify specific inputs).
The data suggests that most traditional aggregation-based defenses (like Median, FedAvg) and some specialized defenses (ShieldFL, FoolsGold, PBFL) have a breaking point. Their protective effect collapses when the attacker controls 40-50% of the clients. Biscotti appears to have a lower breaking point (~30%).
The method labeled **"Ours"** demonstrates a fundamentally different and more robust behavior. Its flat line indicates it can effectively neutralize the backdoor attack regardless of the attacker's prevalence within the tested range. This implies it uses a mechanism that is not fooled by the increased influence of malicious updates, even when they constitute a majority. The chart serves as strong empirical evidence for the superiority of the "Ours" method in defending against backdoor attacks under high-threat conditions.