## Line Graph: Attack Success Rate (ASR) vs. Attack Ratio (%)
### Overview
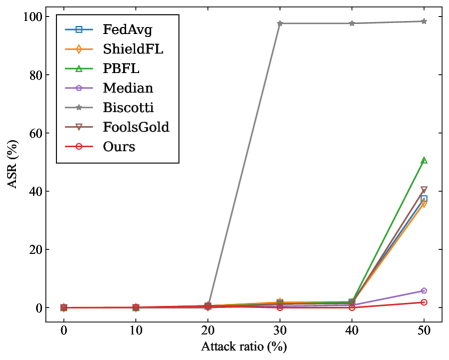
The graph compares the performance of seven machine learning defense mechanisms (FedAvg, ShieldFL, PBFL, Median, Biscotti, FoolsGold, and "Ours") across varying attack ratios (0-50%). ASR (%) is plotted against attack ratio, showing how each method's robustness changes as adversarial pressure increases.
### Components/Axes
- **X-axis**: Attack ratio (%) ranging from 0 to 50 in 10% increments.
- **Y-axis**: Attack Success Rate (ASR) (%) ranging from 0 to 100 in 20% increments.
- **Legend**: Located in the top-right corner, associating colors and markers with methods:
- FedAvg: Blue squares
- ShieldFL: Orange diamonds
- PBFL: Green triangles
- Median: Purple pentagons
- Biscotti: Gray stars
- FoolsGold: Brown inverted triangles
- Ours: Red circles
### Detailed Analysis
1. **Biscotti (Gray Stars)**:
- Dominates the graph, maintaining 100% ASR from 30% attack ratio onward.
- At 20% attack ratio, ASR drops sharply from 100% to ~0%.
- At 0-10% attack ratio, ASR remains near 0%.
2. **FedAvg (Blue Squares)**:
- Gradual increase from 0% to ~35% ASR at 50% attack ratio.
- Flatline at ~0% until 30% attack ratio.
3. **ShieldFL (Orange Diamonds)**:
- Steady rise from 0% to ~37% ASR at 50% attack ratio.
- Minimal performance below 30% attack ratio.
4. **PBFL (Green Triangles)**:
- Sharp upward trajectory starting at 40% attack ratio.
- Reaches ~50% ASR at 50% attack ratio.
- Flatline at ~0% below 40% attack ratio.
5. **Median (Purple Pentagons)**:
- Slow linear increase from 0% to ~6% ASR at 50% attack ratio.
- Minimal performance across all attack ratios.
6. **FoolsGold (Brown Inverted Triangles)**:
- Gradual rise from 0% to ~40% ASR at 50% attack ratio.
- Flatline at ~0% until 40% attack ratio.
7. **Ours (Red Circles)**:
- Steepest increase among non-Biscotti methods.
- Reaches ~40% ASR at 50% attack ratio.
- Flatline at ~0% until 40% attack ratio.
### Key Observations
- **Biscotti's Outlier Performance**: Maintains 100% ASR at 30-50% attack ratios but fails catastrophically at 20%.
- **Gradual vs. Sudden Improvements**: Methods like FedAvg and ShieldFL show incremental gains, while PBFL and "Ours" exhibit threshold-based effectiveness.
- **Attack Ratio Thresholds**: Most methods activate defenses only above 30-40% attack ratios.
- **ASR Saturation**: Biscotti's 100% ASR at high attack ratios suggests theoretical perfection but practical limitations.
### Interpretation
The graph highlights trade-offs between attack ratio resilience and ASR. Biscotti's abrupt performance shift suggests a binary defense mechanism (effective only above 30% attack ratio), while others like "Ours" and FoolsGold demonstrate scalable robustness. The gradual improvements of FedAvg and ShieldFL indicate adaptive defenses but with lower peak performance. Notably, PBFL's late activation (40% attack ratio) implies delayed threat detection. The data underscores the importance of attack ratio thresholds in defense design, with no single method dominating across all scenarios. The "Ours" method's steep curve suggests a promising approach for high-attack environments, though its real-world applicability would require further validation.