## Violin Plot: US Foreign Policy
### Overview
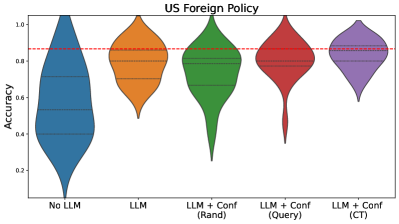
The image is a violin plot comparing the accuracy of different models for US Foreign Policy prediction. The models include a baseline "No LLM" model, an "LLM" model, and three "LLM + Conf" models using different confidence measures: "Rand", "Query", and "CT". The plot shows the distribution of accuracy scores for each model. A red dashed line is drawn horizontally across the plot at approximately y=0.87.
### Components/Axes
* **Title:** US Foreign Policy
* **Y-axis:** Accuracy, ranging from 0.0 to 1.0 in increments of 0.2.
* **X-axis:** Model types:
* No LLM (Blue)
* LLM (Orange)
* LLM + Conf (Rand) (Green)
* LLM + Conf (Query) (Red)
* LLM + Conf (CT) (Purple)
* **Horizontal Dashed Red Line:** Appears to be a reference line at approximately 0.87 accuracy.
### Detailed Analysis
* **No LLM (Blue):** The distribution is skewed towards higher accuracy, with a median around 0.55. The range of accuracy is wide, from approximately 0.05 to 1.0.
* **LLM (Orange):** The distribution is concentrated at higher accuracy values, with a median around 0.85. The range is narrower than "No LLM", from approximately 0.5 to 1.0.
* **LLM + Conf (Rand) (Green):** The distribution is similar to "LLM", with a median around 0.85. The range is approximately 0.3 to 1.0.
* **LLM + Conf (Query) (Red):** The distribution is also concentrated at higher accuracy values, with a median around 0.85. The range is approximately 0.4 to 1.0.
* **LLM + Conf (CT) (Purple):** The distribution is concentrated at higher accuracy values, with a median around 0.85. The range is approximately 0.6 to 1.0.
### Key Observations
* The "No LLM" model has the widest distribution and the lowest median accuracy.
* All models that incorporate an LLM ("LLM", "LLM + Conf (Rand)", "LLM + Conf (Query)", and "LLM + Conf (CT)") show significantly improved accuracy compared to the "No LLM" baseline.
* The "LLM + Conf" models have slightly different distributions, but their medians are all around 0.85.
* The horizontal red dashed line is positioned at approximately 0.87 accuracy, which is slightly above the median accuracy of the LLM models.
### Interpretation
The data suggests that incorporating a Large Language Model (LLM) significantly improves the accuracy of US Foreign Policy prediction compared to a model without an LLM. The different confidence measures ("Rand", "Query", "CT") used in the "LLM + Conf" models do not appear to have a substantial impact on the overall accuracy, as their distributions are similar. The red dashed line may represent a target accuracy level or a benchmark for comparison. The "No LLM" model's wide distribution indicates high variability in its predictions, while the LLM-based models show more consistent and accurate results.