## Violin Plot: US Foreign Policy Accuracy Comparison
### Overview
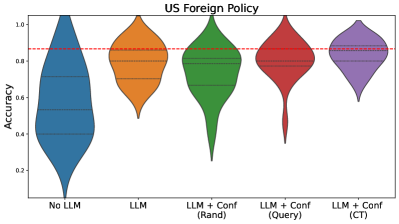
The image presents a comparative analysis of accuracy distributions across five configurations of Large Language Models (LLMs) applied to US Foreign Policy tasks. The plot uses violin plots to visualize the spread and central tendency of accuracy scores, with a red dashed reference line at 0.85 accuracy.
### Components/Axes
- **X-axis**: Categorical configurations:
- No LLM (blue)
- LLM (orange)
- LLM + Conf (Rand) (green)
- LLM + Conf (Query) (red)
- LLM + Conf (CT) (purple)
- **Y-axis**: Accuracy metric (0.0 to 1.0)
- **Key elements**:
- Red dashed line at 0.85 accuracy
- Horizontal gridlines at 0.2, 0.4, 0.6, 0.8
- No explicit legend (colors mapped sequentially to x-axis labels)
### Detailed Analysis
1. **No LLM (blue)**:
- Distribution centered around 0.6 accuracy
- Wide spread with significant lower-tail density
- Median ~0.55, interquartile range ~0.45-0.7
2. **LLM (orange)**:
- Central tendency ~0.75 accuracy
- Narrower distribution than No LLM
- Interquartile range ~0.7-0.8
3. **LLM + Conf (Rand) (green)**:
- Peaks near 0.8 accuracy
- Bimodal distribution with secondary mode ~0.6
- Interquartile range ~0.75-0.85
4. **LLM + Conf (Query) (red)**:
- Tight distribution centered at 0.85
- Sharp peak at threshold line
- Minimal spread (~0.8-0.9)
5. **LLM + Conf (CT) (purple)**:
- Highest central tendency (~0.9 accuracy)
- Narrow distribution with slight right skew
- Interquartile range ~0.85-0.95
### Key Observations
- **Threshold proximity**: Only LLM + Conf (Query) and LLM + Conf (CT) configurations reach/exceed the 0.85 accuracy threshold
- **Progressive improvement**: Each configuration shows incremental accuracy gains:
- No LLM → LLM: +0.15
- LLM → LLM + Conf (Rand): +0.05
- LLM + Conf (Rand) → LLM + Conf (Query): +0.05
- LLM + Conf (Query) → LLM + Conf (CT): +0.05
- **Distribution characteristics**:
- No LLM shows highest variability
- LLM + Conf (CT) demonstrates most consistent performance
- LLM + Conf (Query) has highest density at threshold
### Interpretation
The data demonstrates a clear performance hierarchy among configurations, with each incremental addition of confidence mechanisms (Conf) improving accuracy. The LLM + Conf (CT) configuration achieves near-target performance (0.9 vs 0.85 threshold), suggesting it represents optimal implementation. The bimodal distribution in LLM + Conf (Rand) indicates potential instability in random confidence application, while the tight distribution of LLM + Conf (Query) suggests more reliable performance. The red threshold line serves as a critical benchmark, with only the top two configurations meeting/exceeding this standard. This analysis implies that confidence mechanisms significantly enhance LLM performance on US Foreign Policy tasks, with the CT method providing the most substantial improvement.