\n
## Horizontal Bar Chart: Question Success by GAIA Categories
### Overview
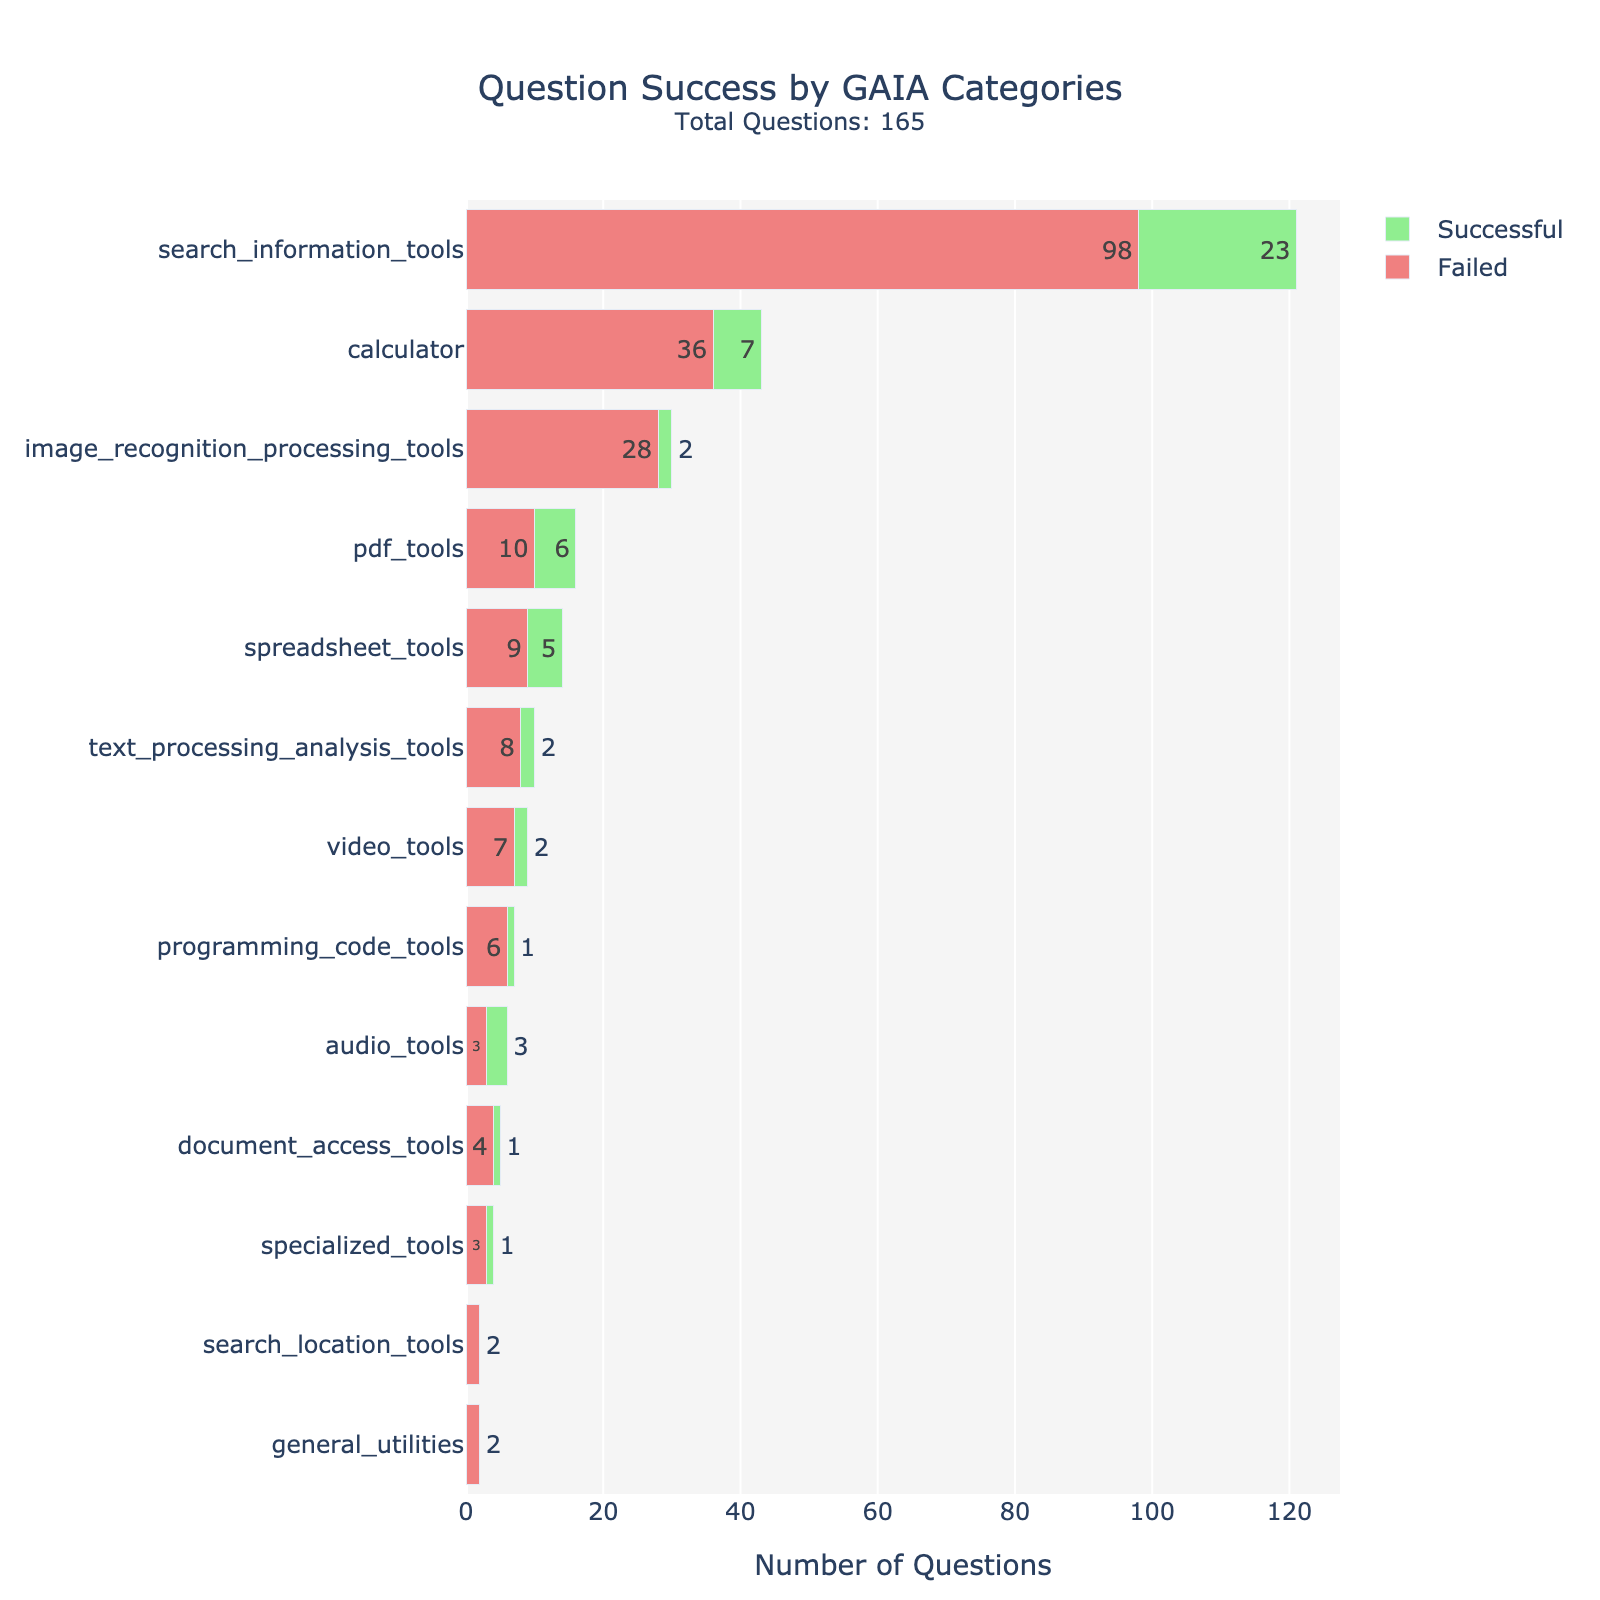
This horizontal bar chart visualizes the success rate of questions categorized by GAIA tools. Each bar represents a tool category, with segments indicating the number of successful and failed questions. The total number of questions is 165.
### Components/Axes
* **Title:** "Question Success by GAIA Categories"
* **Subtitle:** "Total Questions: 165" (positioned below the title)
* **Y-axis:** Lists the GAIA tool categories:
* search\_information\_tools
* calculator
* image\_recognition\_processing\_tools
* pdf\_tools
* spreadsheet\_tools
* text\_processing\_analysis\_tools
* video\_tools
* programming\_code\_tools
* audio\_tools
* document\_access\_tools
* specialized\_tools
* search\_location\_tools
* general\_utilities
* **X-axis:** "Number of Questions" (ranging from 0 to 120)
* **Legend:** Located in the top-right corner:
* Green: "Successful"
* Red: "Failed"
### Detailed Analysis
The chart displays the number of successful and failed questions for each category. The bars are arranged vertically, with the category names on the left.
* **search\_information\_tools:** 98 Successful, 23 Failed
* **calculator:** 36 Successful, 7 Failed
* **image\_recognition\_processing\_tools:** 28 Successful, 2 Failed
* **pdf\_tools:** 10 Successful, 6 Failed
* **spreadsheet\_tools:** 9 Successful, 5 Failed
* **text\_processing\_analysis\_tools:** 8 Successful, 2 Failed
* **video\_tools:** 7 Successful, 2 Failed
* **programming\_code\_tools:** 6 Successful, 1 Failed
* **audio\_tools:** 3 Successful, 0 Failed
* **document\_access\_tools:** 4 Successful, 1 Failed
* **specialized\_tools:** 1 Successful, 0 Failed
* **search\_location\_tools:** 2 Successful, 0 Failed
* **general\_utilities:** 2 Successful, 0 Failed
The bars generally show a clear dominance of successful questions over failed questions in most categories.
### Key Observations
* **Highest Success:** "search\_information\_tools" has the highest number of successful questions (98) and the highest total number of questions (121).
* **Lowest Success:** "specialized\_tools" has the lowest number of successful questions (1).
* **High Failure Rate:** "pdf\_tools" has a relatively high number of failed questions (6) compared to its successful questions (10).
* **Zero Failures:** Several categories ("audio\_tools", "specialized\_tools", "search\_location\_tools", "general\_utilities") have zero failed questions.
### Interpretation
The data suggests that the GAIA system performs exceptionally well in "search\_information\_tools," indicating a strong capability in information retrieval. Categories like "calculator" and "image\_recognition\_processing\_tools" also demonstrate good success rates. However, "pdf\_tools" appears to be an area needing improvement, as it has a noticeable number of failures. The categories with very few questions overall ("specialized\_tools", "search\_location\_tools", "general\_utilities") may not have sufficient data to draw firm conclusions.
The relationship between the categories and their success rates likely reflects the complexity of the tasks involved. Simpler tasks, like basic calculations, may have higher success rates than more complex ones, like processing PDFs. The overall high success rate (165 total questions, with a clear majority being successful) indicates that the GAIA system is generally effective. The data could be used to prioritize development efforts, focusing on improving the performance of categories with lower success rates, such as "pdf\_tools".