## Horizontal Bar Chart: Question Success by GAIA Categories
### Overview
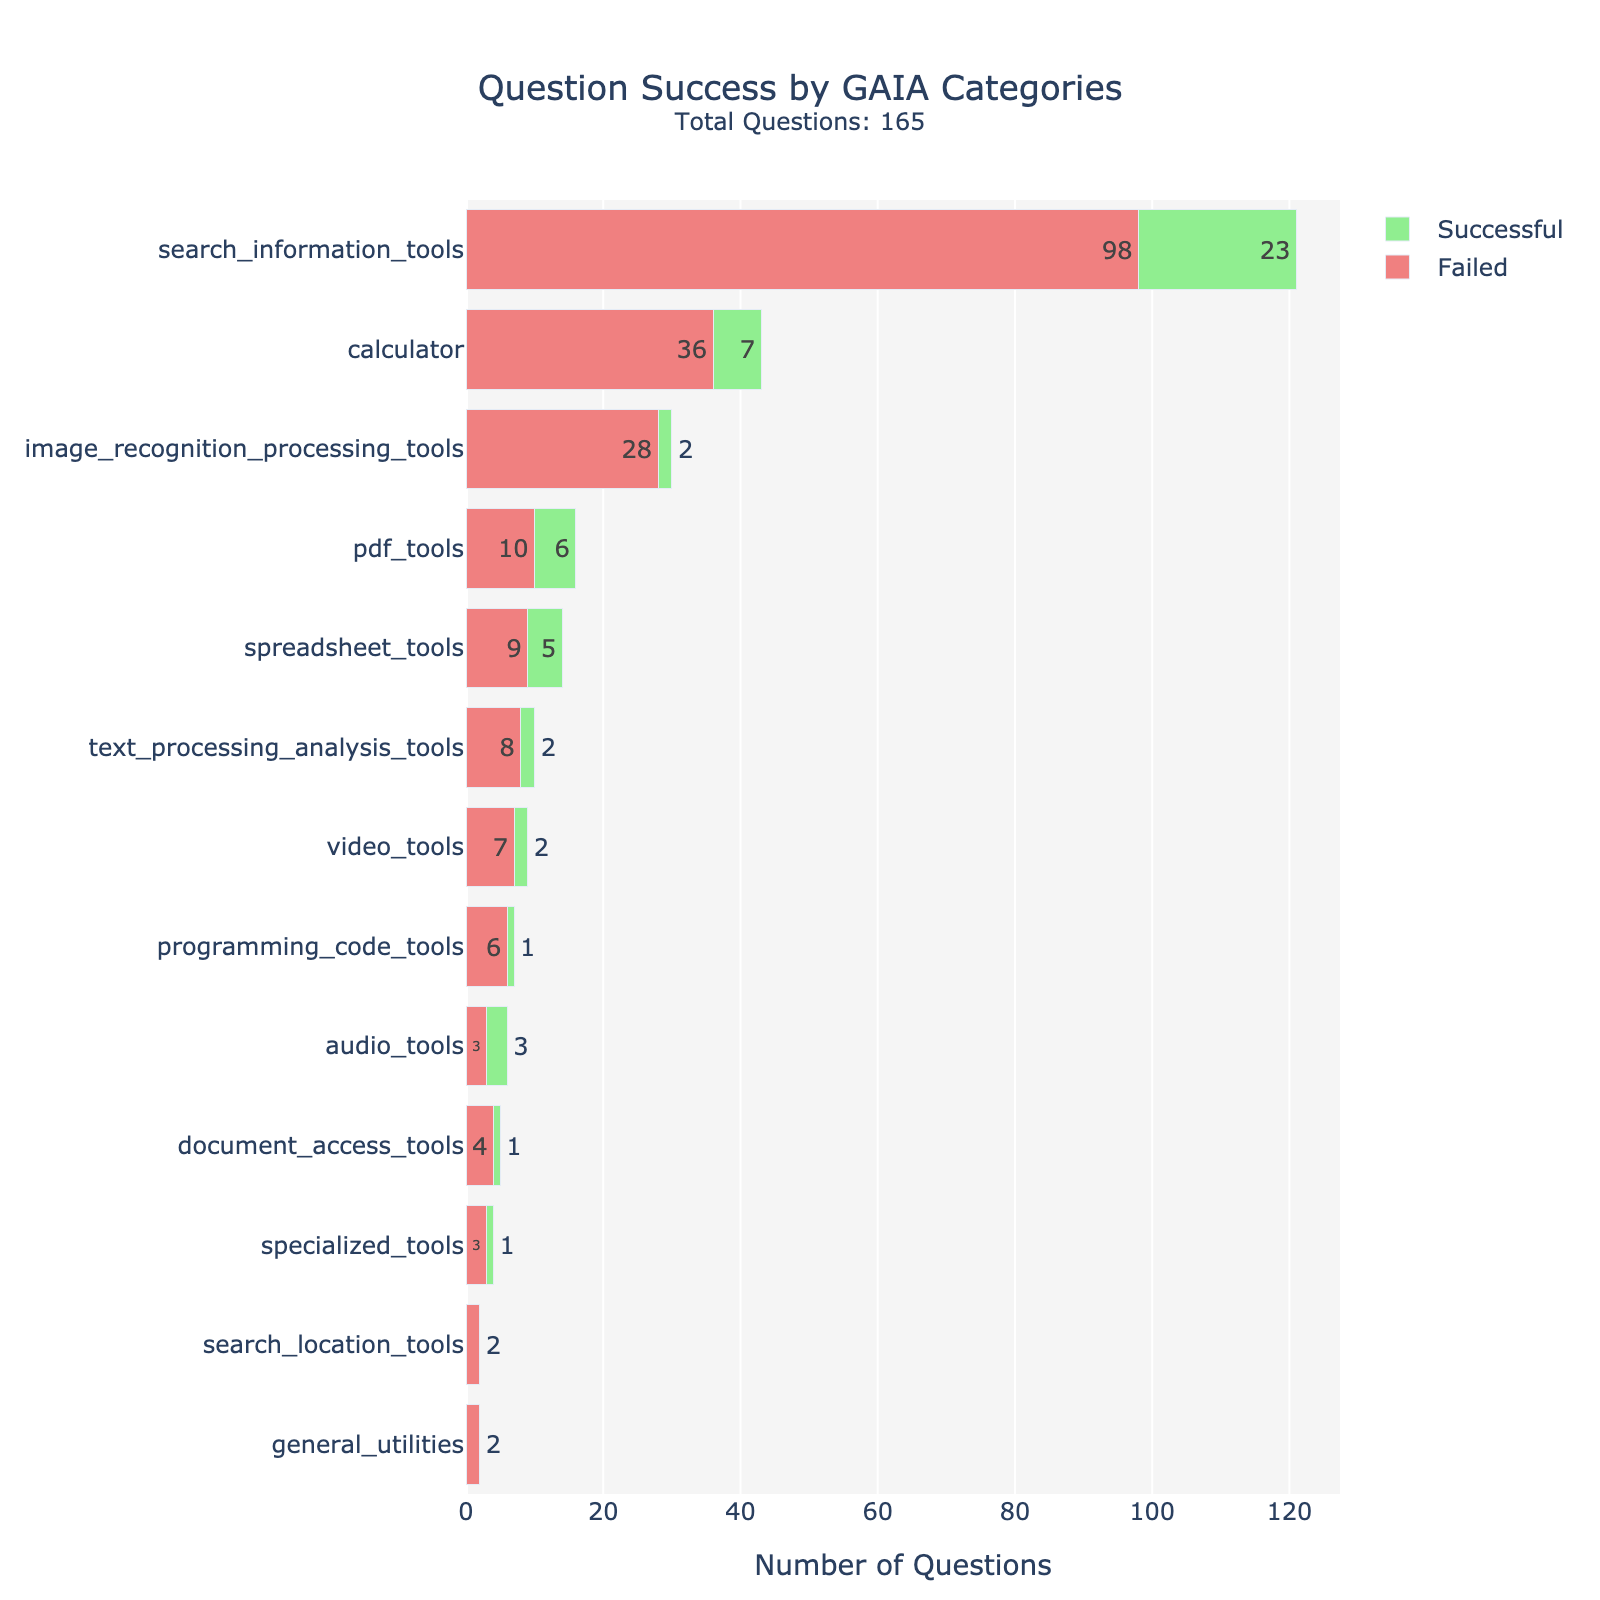
The chart visualizes the success and failure rates of questions categorized under different GAIA (Generative AI) domains. It uses horizontal bars to represent the number of questions, with red indicating failed questions and green indicating successful ones. The total number of questions across all categories is 165.
### Components/Axes
- **X-Axis**: Labeled "Number of Questions," ranging from 0 to 120.
- **Y-Axis**: Lists GAIA categories in descending order of total questions (failed + successful).
- **Legend**: Located on the right, with green representing successful questions and red representing failed questions.
### Detailed Analysis
1. **search_information_tools**:
- Failed: 98 (red bar)
- Successful: 23 (green bar)
2. **calculator**:
- Failed: 36
- Successful: 7
3. **image_recognition_processing_tools**:
- Failed: 28
- Successful: 2
4. **pdf_tools**:
- Failed: 10
- Successful: 6
5. **spreadsheet_tools**:
- Failed: 9
- Successful: 5
6. **text_processing_analysis_tools**:
- Failed: 8
- Successful: 2
7. **video_tools**:
- Failed: 7
- Successful: 2
8. **programming_code_tools**:
- Failed: 6
- Successful: 1
9. **audio_tools**:
- Failed: 3
- Successful: 3
10. **document_access_tools**:
- Failed: 4
- Successful: 1
11. **specialized_tools**:
- Failed: 3
- Successful: 1
12. **search_location_tools**:
- Failed: 2
- Successful: 0
13. **general_utilities**:
- Failed: 2
- Successful: 0
### Key Observations
- **Highest Failed Questions**: `search_information_tools` dominates with 98 failed questions, despite having the highest total (121 questions).
- **Lowest Successful Questions**: `search_location_tools` and `general_utilities` have 0 successful questions.
- **Balanced Performance**: `audio_tools` has equal failed (3) and successful (3) questions.
- **Discrepancy in Totals**: The sum of all failed (216) and successful (53) questions exceeds the stated total of 165, suggesting potential data inconsistency or misinterpretation of the chart.
### Interpretation
The data highlights that `search_information_tools` is the most frequently queried category but struggles with high failure rates. Categories like `audio_tools` show balanced performance, while others (e.g., `search_location_tools`) have no successful outcomes. The mismatch between the total questions (165) and the sum of individual category totals (269) indicates a possible error in data aggregation or visualization. This could imply overlapping categories, mislabeled data, or an incomplete dataset. Further validation of the source data is recommended to resolve this inconsistency.