## Horizontal Bar Chart: Compliance by Provider (Weighted)
### Overview
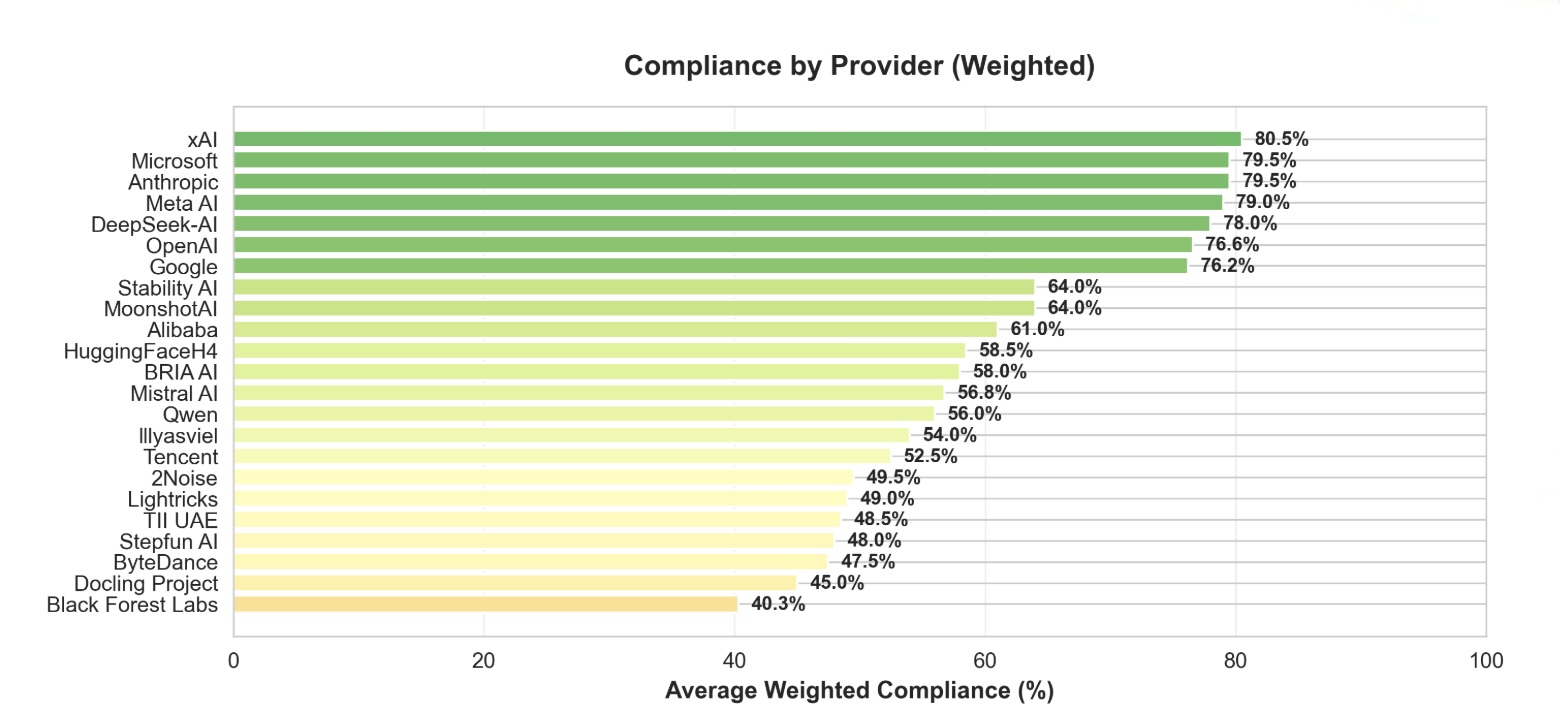
The image is a horizontal bar chart displaying the average weighted compliance of various providers. The chart ranks providers from highest to lowest compliance, with the x-axis representing the average weighted compliance percentage and the y-axis listing the providers. The bars are colored in a gradient from yellow to green, with green indicating higher compliance.
### Components/Axes
* **Title:** Compliance by Provider (Weighted)
* **X-axis:** Average Weighted Compliance (%), with scale from 0 to 100, incrementing by 20.
* **Y-axis:** List of providers (xAI, Microsoft, Anthropic, Meta AI, DeepSeek-AI, OpenAI, Google, Stability AI, MoonshotAI, Alibaba, HuggingFaceH4, BRIA AI, Mistral AI, Qwen, Illyasviel, Tencent, 2Noise, Lightricks, TII UAE, Stepfun AI, ByteDance, Docling Project, Black Forest Labs).
* **Bars:** Horizontal bars representing the compliance percentage for each provider. The bars are colored in a gradient from yellow to green, with green indicating higher compliance.
### Detailed Analysis
The chart presents the following data points for each provider:
* **xAI:** 80.5% (Green)
* **Microsoft:** 79.5% (Green)
* **Anthropic:** 79.5% (Green)
* **Meta AI:** 79.0% (Green)
* **DeepSeek-AI:** 78.0% (Green)
* **OpenAI:** 76.6% (Green)
* **Google:** 76.2% (Green)
* **Stability AI:** 64.0% (Yellow-Green)
* **MoonshotAI:** 64.0% (Yellow-Green)
* **Alibaba:** 61.0% (Yellow-Green)
* **HuggingFaceH4:** 58.5% (Yellow-Green)
* **BRIA AI:** 58.0% (Yellow-Green)
* **Mistral AI:** 56.8% (Yellow-Green)
* **Qwen:** 56.0% (Yellow-Green)
* **Illyasviel:** 54.0% (Yellow-Green)
* **Tencent:** 52.5% (Yellow-Green)
* **2Noise:** 49.5% (Yellow)
* **Lightricks:** 49.0% (Yellow)
* **TII UAE:** 48.5% (Yellow)
* **Stepfun AI:** 48.0% (Yellow)
* **ByteDance:** 47.5% (Yellow)
* **Docling Project:** 45.0% (Yellow)
* **Black Forest Labs:** 40.3% (Yellow)
### Key Observations
* xAI has the highest average weighted compliance at 80.5%.
* Black Forest Labs has the lowest average weighted compliance at 40.3%.
* There is a clear distinction between the top 7 providers (xAI to Google) and the rest, with a significant drop in compliance percentage after Google.
* The compliance percentages range from 40.3% to 80.5%, indicating a wide variation in compliance among the listed providers.
### Interpretation
The chart illustrates the relative compliance of different AI providers based on a weighted average. The data suggests that some providers are significantly more compliant than others, with xAI leading the pack. The color gradient visually reinforces this, highlighting the higher compliance of the top providers. The wide range in compliance percentages could be attributed to various factors, such as differences in internal policies, implementation of compliance measures, or the nature of the AI services offered. The chart provides a snapshot of the compliance landscape among these providers, which could be useful for benchmarking, regulatory oversight, or informing consumer choices.