## Bar Chart: Compliance by Provider (Weighted)
### Overview
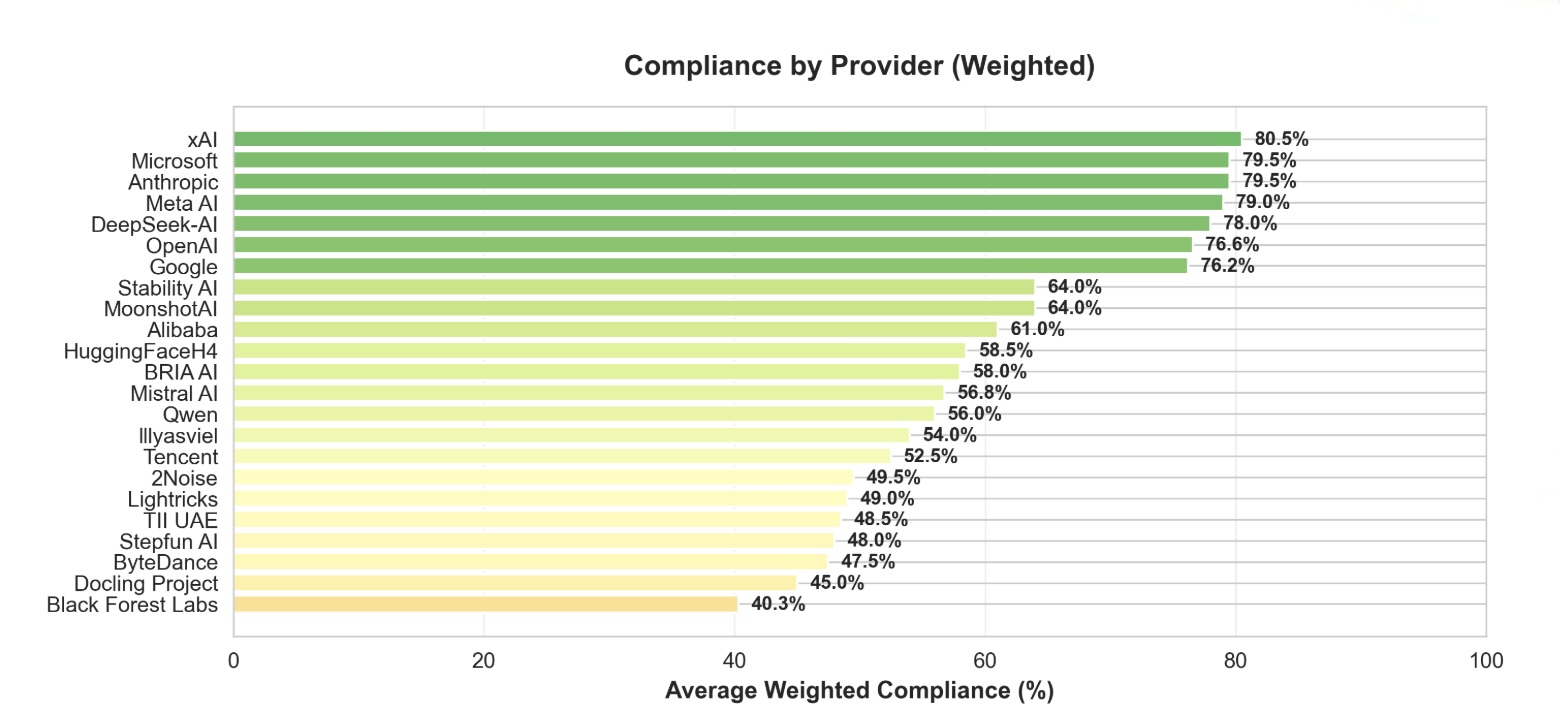
The chart visualizes the average weighted compliance percentages of various AI providers, ranked from highest to lowest compliance. Compliance is represented by horizontal bars transitioning from green (high compliance) to orange (low compliance), with numerical values displayed at the end of each bar.
### Components/Axes
- **X-Axis**: "Average Weighted Compliance (%)" (0–100 scale)
- **Y-Axis**: List of AI providers (ordered by compliance, top to bottom)
- **Legend**: Implied color gradient (green = high compliance, orange = low compliance)
- **Key Labels**: Provider names and compliance percentages (e.g., "xAI: 80.5%")
### Detailed Analysis
1. **Top Performers (Green Bars)**:
- xAI: 80.5%
- Microsoft: 79.5%
- Anthropic: 79.5%
- Meta AI: 79.0%
- DeepSeek-AI: 78.0%
- OpenAI: 76.6%
- Google: 76.2%
2. **Mid-Tier Providers (Yellow-Green Bars)**:
- Stability AI: 64.0%
- MoonshotAI: 64.0%
- Alibaba: 61.0%
- HuggingFaceH4: 58.5%
- BRIA AI: 58.0%
- Mistral AI: 56.8%
- Qwen: 56.0%
- Iliyasviel: 54.0%
- Tencent: 52.5%
3. **Lower Compliance (Yellow-Orange Bars)**:
- 2Noise: 49.5%
- Lighttricks: 49.0%
- TII UAE: 48.5%
- Stepfun AI: 48.0%
- ByteDance: 47.5%
- Docling Project: 45.0%
- Black Forest Labs: 40.3%
### Key Observations
- **Dominance of Major Providers**: The top 7 providers (xAI, Microsoft, Anthropic, Meta AI, DeepSeek-AI, OpenAI, Google) all exceed 76% compliance, with xAI leading at 80.5%.
- **Significant Drop-Off**: Compliance drops sharply after the top 7, with Stability AI and MoonshotAI at 64%.
- **Lowest Compliance**: Black Forest Labs (40.3%) and Docling Project (45.0%) are the only providers below 50%.
- **Color Gradient**: Green dominates the top 7, yellow-green covers mid-tier providers, and orange-yellow represents the lowest performers.
### Interpretation
The chart highlights a clear hierarchy in compliance among AI providers, with major players like xAI and Microsoft demonstrating significantly higher adherence to standards compared to smaller or newer entities. The weighted average suggests compliance may be influenced by factors such as organizational maturity, regulatory pressure, or resource allocation. The stark contrast between the top performers and lower-tier providers (e.g., Black Forest Labs at 40.3%) raises questions about industry-wide challenges in meeting compliance benchmarks. The color gradient effectively communicates performance tiers, though the absence of an explicit legend leaves room for ambiguity in interpreting the exact meaning of the color transitions.