## Line Chart: Accuracy vs. Top η (%)
### Overview
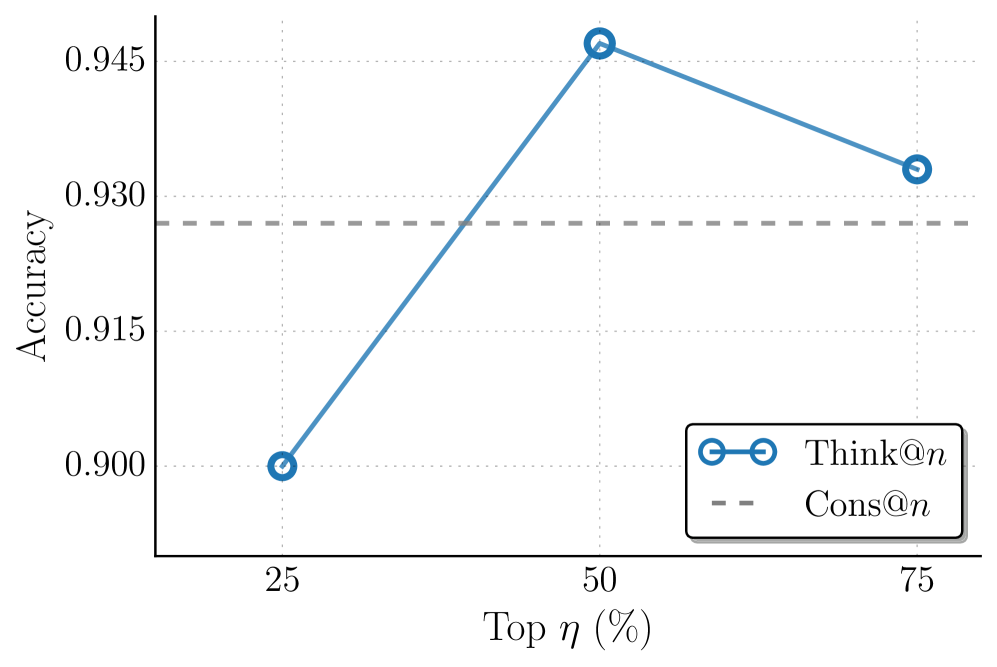
The image displays a line chart comparing the accuracy of two methods, "Think@n" and "Cons@n," across three different thresholds of "Top η (%)". The chart plots Accuracy on the y-axis against the Top η percentage on the x-axis.
### Components/Axes
* **Y-Axis:** Labeled "Accuracy". The scale ranges from 0.900 to 0.945, with major gridlines at intervals of 0.015 (0.900, 0.915, 0.930, 0.945).
* **X-Axis:** Labeled "Top η (%)". It has three discrete markers at 25, 50, and 75.
* **Legend:** Located in the bottom-right corner of the plot area.
* A solid blue line with open circle markers is labeled "Think@n".
* A gray dashed line is labeled "Cons@n".
* **Data Series:**
1. **Think@n (Solid Blue Line with Circles):** This series shows a non-linear trend.
2. **Cons@n (Gray Dashed Line):** This series is a horizontal line, indicating a constant value.
### Detailed Analysis
**Data Points for "Think@n":**
* At **Top η = 25%**, Accuracy is **0.900**.
* At **Top η = 50%**, Accuracy peaks at **0.945**.
* At **Top η = 75%**, Accuracy decreases to **0.930**.
**Data Point for "Cons@n":**
* The dashed line is horizontal, indicating a constant Accuracy value across all Top η percentages. Visually, it aligns with a value of approximately **0.925** (positioned between the 0.915 and 0.930 gridlines, slightly closer to 0.930).
**Trend Verification:**
* **Think@n Trend:** The line slopes sharply upward from 25% to 50%, then slopes downward from 50% to 75%. This indicates a peak performance at the 50% threshold.
* **Cons@n Trend:** The line is perfectly flat, showing no change in accuracy as the Top η percentage varies.
### Key Observations
1. **Performance Peak:** The "Think@n" method achieves its highest accuracy (0.945) at the 50% Top η threshold.
2. **Crossover Point:** The "Think@n" line crosses above the "Cons@n" line between the 25% and 50% marks. At 50%, Think@n (0.945) significantly outperforms Cons@n (~0.925). At 75%, Think@n (0.930) remains slightly above Cons@n (~0.925).
3. **Stability vs. Variability:** "Cons@n" demonstrates stable, consistent performance, while "Think@n" is more sensitive to the Top η parameter, showing both higher potential and a drop-off after the peak.
### Interpretation
This chart likely evaluates two different strategies ("Think@n" and "Cons@n") for a selection or filtering task, where "Top η (%)" represents the percentage of top candidates considered.
* **What the data suggests:** The "Think@n" strategy benefits from a moderate filtering threshold (50%), achieving superior accuracy. However, being too selective (75%) or not selective enough (25%) reduces its effectiveness. In contrast, the "Cons@n" strategy's performance is invariant to the selection threshold, suggesting it may be a more robust or baseline method that doesn't rely on the same top-% filtering mechanism.
* **Relationship between elements:** The chart directly contrasts a parameter-sensitive method against a parameter-invariant one. The key takeaway is the identification of an optimal operating point (50% Top η) for the "Think@n" approach.
* **Notable anomaly:** The sharp decline in "Think@n" accuracy from 50% to 75% is notable. It implies that the most confident 25% of predictions (the top 75% vs. top 50%) may include noisy or incorrect labels that degrade overall accuracy, a phenomenon sometimes seen in self-training or pseudo-labeling scenarios.