This document provides a detailed technical extraction and analysis of the provided image, which contains three distinct charts labeled (a), (b), and (c).
## [Charts]: Network Growth and Connectivity Analysis
### Overview
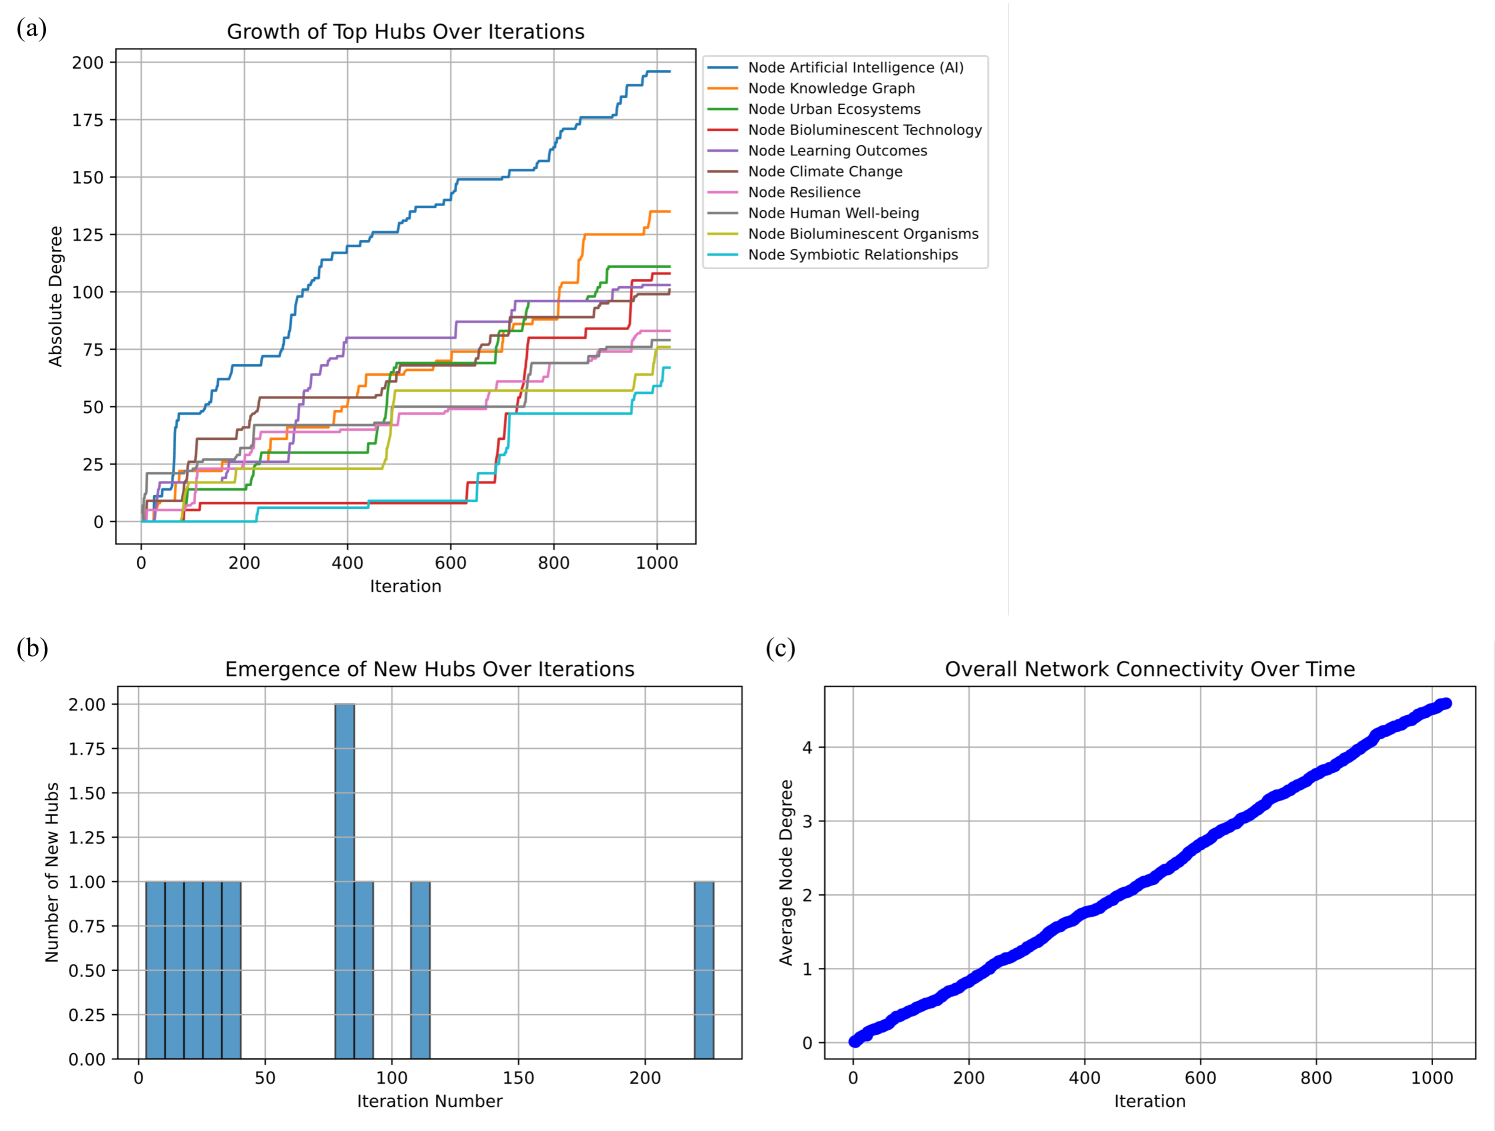
The image displays three related charts analyzing the evolution of a network over time (iterations).
* **Chart (a)** tracks the "Absolute Degree" (number of connections) of the top 10 specific nodes over 1000 iterations.
* **Chart (b)** tracks the "Number of New Hubs" emerging over the first ~225 iterations.
* **Chart (c)** tracks the "Average Node Degree" of the entire network over 1000 iterations.
The language used in all charts is English.
---
### Chart (a): Growth of Top Hubs Over Iterations
#### Components/Axes
* **X-Axis:** "Iteration" (Scale: 0 to 1000).
* **Y-Axis:** "Absolute Degree" (Scale: 0 to 200).
* **Legend:** Located in the top-right corner. It maps colors to specific node names:
* **Blue:** Node Artificial Intelligence (AI)
* **Orange:** Node Knowledge Graph
* **Green:** Node Urban Ecosystems
* **Red:** Node Bioluminescent Technology
* **Purple:** Node Learning Outcomes
* **Brown:** Node Climate Change
* **Pink:** Node Resilience
* **Gray:** Node Human Well-being
* **Yellow:** Node Bioluminescent Organisms
* **Cyan:** Node Symbiotic Relationships
#### Detailed Analysis
The chart displays a "staircase" growth pattern for all series, indicating that nodes gain connections in discrete bursts rather than continuous growth.
* **Trend Verification:** All lines slope upward, indicating positive growth in connectivity over time.
* **Data Points (Approximate values at Iteration 1000):**
* **Blue (AI):** The clear outlier. It shows the most aggressive growth, reaching an absolute degree of approximately **195**.
* **Orange (Knowledge Graph):** Reaches approximately **135**.
* **Green (Urban Ecosystems):** Reaches approximately **110**.
* **Red (Bioluminescent Tech):** Reaches approximately **108**.
* **Brown (Climate Change):** Reaches approximately **108**.
* **Purple (Learning Outcomes):** Reaches approximately **95**.
* **Pink (Resilience):** Reaches approximately **80**.
* **Gray (Human Well-being):** Reaches approximately **75**.
* **Yellow (Bioluminescent Organisms):** Reaches approximately **65**.
* **Cyan (Symbiotic Relationships):** Reaches approximately **65**.
---
### Chart (b): Emergence of New Hubs Over Iterations
#### Components/Axes
* **X-Axis:** "Iteration Number" (Scale: 0 to 200+).
* **Y-Axis:** "Number of New Hubs" (Scale: 0.00 to 2.00).
#### Detailed Analysis
This is a bar chart (histogram) showing the frequency of new hub emergence.
* **Trend:** The emergence of new hubs is concentrated in the early stages of the simulation.
* **Key Observations:**
* There is a consistent emergence of 1 new hub per iteration between iterations 0 and 40.
* There is a notable gap (no new hubs) between approximately iteration 40 and 80.
* A spike occurs around iteration 80, where 2 new hubs emerge simultaneously.
* Sporadic emergence continues until approximately iteration 225, after which no new hubs are recorded in this view.
---
### Chart (c): Overall Network Connectivity Over Time
#### Components/Axes
* **X-Axis:** "Iteration" (Scale: 0 to 1000).
* **Y-Axis:** "Average Node Degree" (Scale: 0 to 4+).
#### Detailed Analysis
This is a scatter plot (appearing as a dense line) showing the global average connectivity of the network.
* **Trend:** The line slopes upward linearly and consistently.
* **Data Points:**
* At iteration 0, the average degree is 0.
* At iteration 1000, the average degree is approximately 4.5.
* **Observation:** The growth is remarkably steady, suggesting that while individual hubs (from Chart a) grow in bursts, the aggregate network density increases at a constant rate.
---
### Interpretation
The data suggests a classic **"Rich-Get-Richer" (Preferential Attachment)** phenomenon within the network:
1. **Dominance of AI:** The "Node Artificial Intelligence (AI)" is the clear dominant hub. Its growth rate significantly outpaces all other nodes, suggesting that in this network, AI acts as a central attractor for connections.
2. **Network Maturation:** Chart (b) demonstrates that the "birth" of new hubs is a front-loaded process. The network establishes its core structure early (within the first 200 iterations) and then focuses on expanding the connectivity of existing nodes rather than creating new ones.
3. **Global Densification:** Chart (c) confirms that despite the uneven growth of individual nodes (the "staircase" effect in Chart a), the network as a whole is densifying at a very predictable, linear rate.
4. **Anomalies:** The gap in Chart (b) between iterations 40 and 80 suggests a potential "stabilization phase" or a transition period in the network's evolution where the system was reorganizing rather than expanding its hub count. The spike at iteration 80 suggests a sudden event or threshold was crossed, triggering the creation of two hubs at once.