TECHNICAL ASSET FINGERPRINT
f863f3fac805bd1f8236a199
Click to view fullscreen
Press ESC or click to close
FOUND IN PAPERS
EXPERT: healer-alpha-free VERSION 1
RUNTIME: free/openrouter/healer-alpha
INTEL_VERIFIED
\n
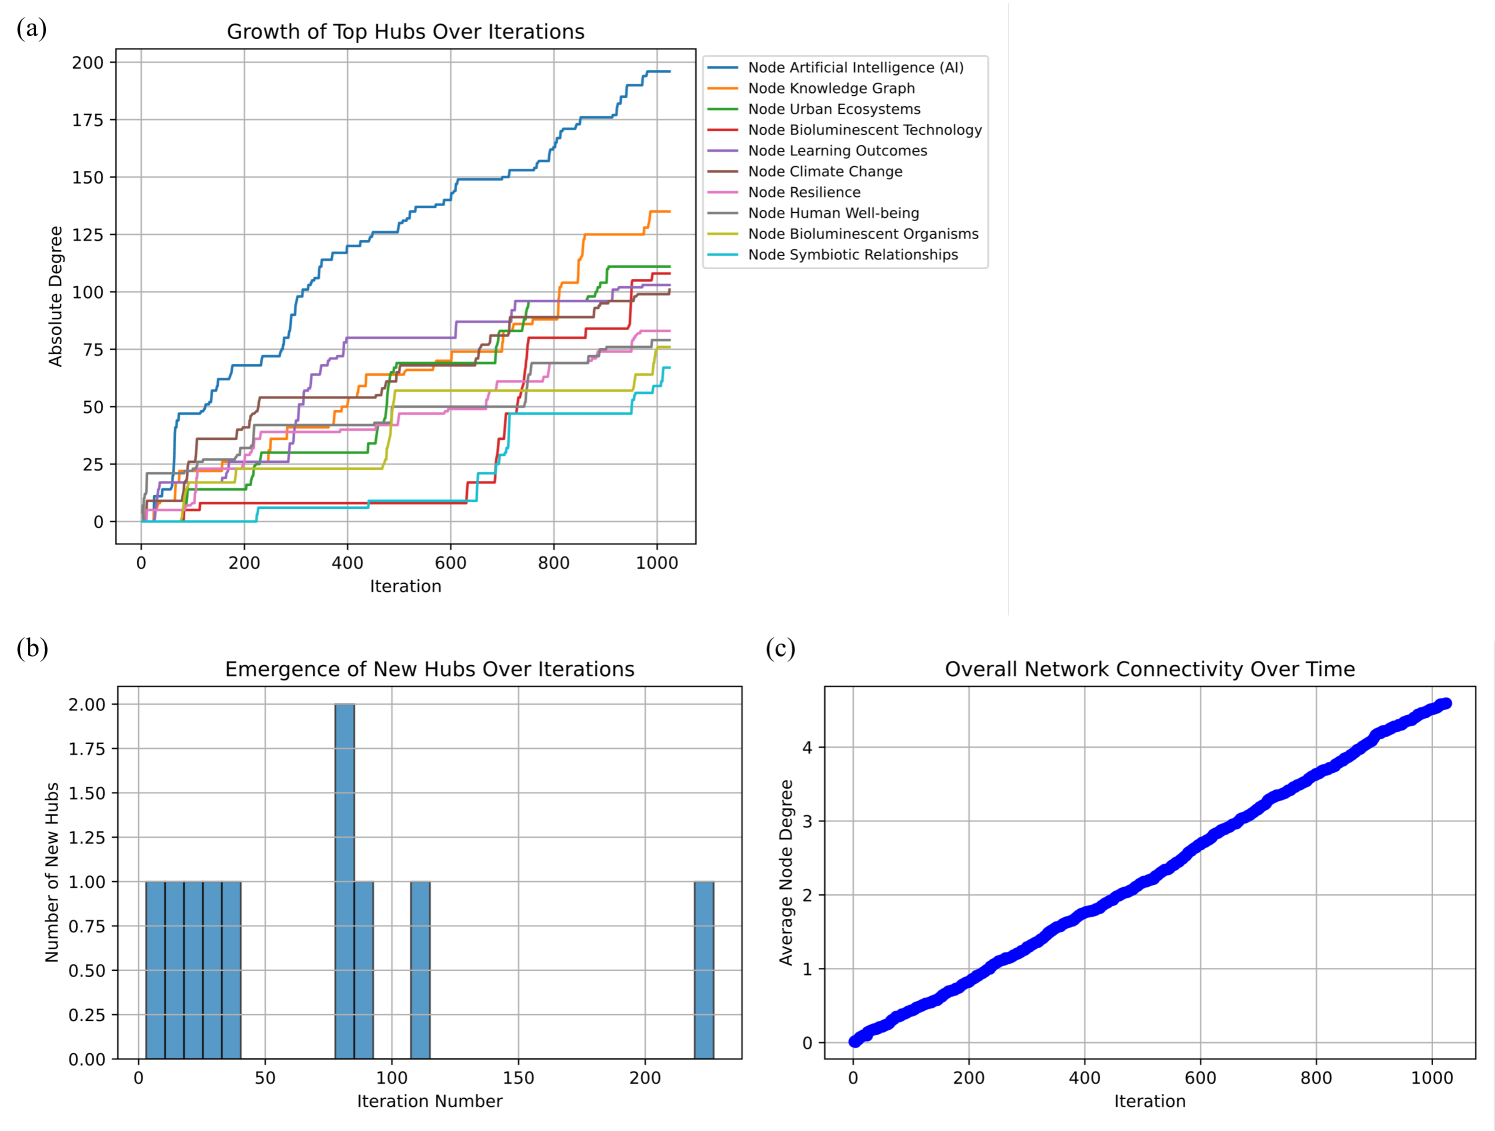
## [Multi-Panel Chart]: Network Evolution Analysis
### Overview
The image contains three distinct charts labeled (a), (b), and (c), which collectively analyze the evolution of a network over a series of iterations. The charts track the growth of specific nodes (hubs), the emergence of new hubs, and the overall network connectivity. The data suggests a simulation or model of a growing network, likely demonstrating principles of preferential attachment or scale-free network formation.
### Components/Axes
**Chart (a): Growth of Top Hubs Over Iterations**
* **Type:** Line Chart
* **X-Axis:** Label: "Iteration". Scale: 0 to 1000, with major ticks every 200 units.
* **Y-Axis:** Label: "Absolute Degree". Scale: 0 to 200, with major ticks every 25 units.
* **Legend:** Located in the top-right corner of the plot area. Contains 10 entries, each associating a color with a specific node label.
* Blue: Node Artificial Intelligence (AI)
* Orange: Node Knowledge Graph
* Green: Node Urban Ecosystems
* Red: Node Bioluminescent Technology
* Purple: Node Learning Outcomes
* Brown: Node Climate Change
* Pink: Node Resilience
* Gray: Node Human Well-being
* Olive: Node Bioluminescent Organisms
* Cyan: Node Symbiotic Relationships
**Chart (b): Emergence of New Hubs Over Iterations**
* **Type:** Bar Chart (Histogram-like)
* **X-Axis:** Label: "Iteration Number". Scale: 0 to 200, with major ticks every 50 units.
* **Y-Axis:** Label: "Number of New Hubs". Scale: 0.00 to 2.00, with major ticks every 0.25 units.
**Chart (c): Overall Network Connectivity Over Time**
* **Type:** Line Chart
* **X-Axis:** Label: "Iteration". Scale: 0 to 1000, with major ticks every 200 units.
* **Y-Axis:** Label: "Average Node Degree". Scale: 0 to 4.5, with major ticks every 1 unit.
### Detailed Analysis
**Chart (a): Growth of Top Hubs Over Iterations**
This chart tracks the "Absolute Degree" (number of connections) for 10 specific nodes across 1000 iterations. All lines show a non-decreasing, step-like growth pattern, indicating that connections are added in discrete events.
* **Node Artificial Intelligence (AI) [Blue Line]:** Shows the most dominant and consistent growth. Starts near 0, experiences a sharp increase around iteration 50-100, and continues a strong upward trend, ending as the highest node with an approximate degree of **195** at iteration 1000.
* **Node Knowledge Graph [Orange Line]:** The second-highest performer. Begins growing later than the AI node, with significant jumps around iterations 400 and 700. Ends with an approximate degree of **135**.
* **Node Urban Ecosystems [Green Line]:** Shows moderate growth, ending with an approximate degree of **110**.
* **Node Bioluminescent Technology [Red Line]:** Follows a similar trajectory to Urban Ecosystems, ending with an approximate degree of **105**.
* **Node Learning Outcomes [Purple Line]:** Grows steadily in the middle of the pack, ending with an approximate degree of **100**.
* **Node Climate Change [Brown Line]:** Grows early but plateaus somewhat in the later iterations, ending with an approximate degree of **80**.
* **Node Resilience [Pink Line]:** Shows a late surge after iteration 600, ending with an approximate degree of **80**.
* **Node Human Well-being [Gray Line]:** Grows slowly and steadily, ending with an approximate degree of **75**.
* **Node Bioluminescent Organisms [Olive Line]:** Remains relatively low until a sharp increase after iteration 900, ending with an approximate degree of **65**.
* **Node Symbiotic Relationships [Cyan Line]:** The lowest-performing node in this set, with most growth occurring after iteration 600, ending with an approximate degree of **65**.
**Chart (b): Emergence of New Hubs Over Iterations**
This chart shows discrete events where new nodes achieve "hub" status (likely defined by a degree threshold). The x-axis is zoomed into the first ~230 iterations.
* **Cluster 1 (Iterations 0-40):** A series of bars, each with a height of **1.0**, indicating one new hub emerged per iteration in this early phase.
* **Cluster 2 (Iterations 80-90):** A prominent bar at approximately iteration 85 with a height of **2.0**, indicating two new hubs emerged simultaneously. This is followed by single-hub bars at iterations ~90 and ~110.
* **Isolated Event (Iteration ~225):** A single bar with a height of **1.0**.
* **Interpretation:** New hub formation is not continuous but occurs in bursts, with a notable peak of activity around iteration 85.
**Chart (c): Overall Network Connectivity Over Time**
This chart shows a single, thick blue line representing the average node degree across the entire network.
* **Trend:** The line shows a remarkably steady, near-linear increase from an average degree of **~0.1** at iteration 0 to **~4.6** at iteration 1000.
* **Implication:** The overall network is becoming denser and more connected at a constant rate over time, despite the uneven growth of individual hubs seen in chart (a).
### Key Observations
1. **Dominant Hub:** The "Artificial Intelligence (AI)" node is the clear outlier in growth, consistently outpacing all other tracked nodes.
2. **Growth Phases:** Hub growth is not smooth but occurs in steps or bursts, suggesting connection events are discrete and possibly triggered by specific model conditions.
3. **Hub Emergence Timing:** The formation of new hubs (chart b) is concentrated in the early phase of the network's evolution (first 120 iterations), with very few new hubs appearing later.
4. **Steady Macro Trend:** Despite the chaotic and unequal growth at the node level (chart a), the network's overall connectivity (chart c) increases with striking regularity.
### Interpretation
The three charts together tell a story of **network evolution under a preferential attachment mechanism** (like the Barabási–Albert model). The data suggests:
* **"The Rich Get Richer":** The early and rapid growth of the AI node (chart a) indicates it likely gained an early advantage, attracting new connections at an accelerating rate simply because it was already large. This is a hallmark of scale-free networks.
* **Network Maturation:** The burst of new hub creation early on (chart b) followed by a long period with few new hubs suggests the network's core structure is established early. Later growth primarily reinforces existing hubs rather than creating new ones.
* **Predictable System-Level Behavior:** The perfectly linear growth in average degree (chart c) is a powerful finding. It indicates that while individual node fates are highly variable and path-dependent, the system as a whole evolves with predictable, steady densification. This could be a designed property of the simulation or an emergent property of the attachment rules.
* **Domain Context:** The node labels (AI, Knowledge Graph, Urban Ecosystems, etc.) imply this network model might be simulating the growth of a **knowledge graph, a technological ecosystem, or a conceptual map** where ideas or technologies build upon each other. The dominance of the "AI" node could reflect a hypothesis about its central, integrative role in such a system.
**Conclusion:** The visualization effectively demonstrates how simple local rules (e.g., preferential attachment) can lead to complex global outcomes: the emergence of dominant hubs, sporadic structural changes, and yet, remarkably stable and predictable system-wide metrics.
DECODING INTELLIGENCE...