## Composite Visualization: Network Evolution Metrics
### Overview
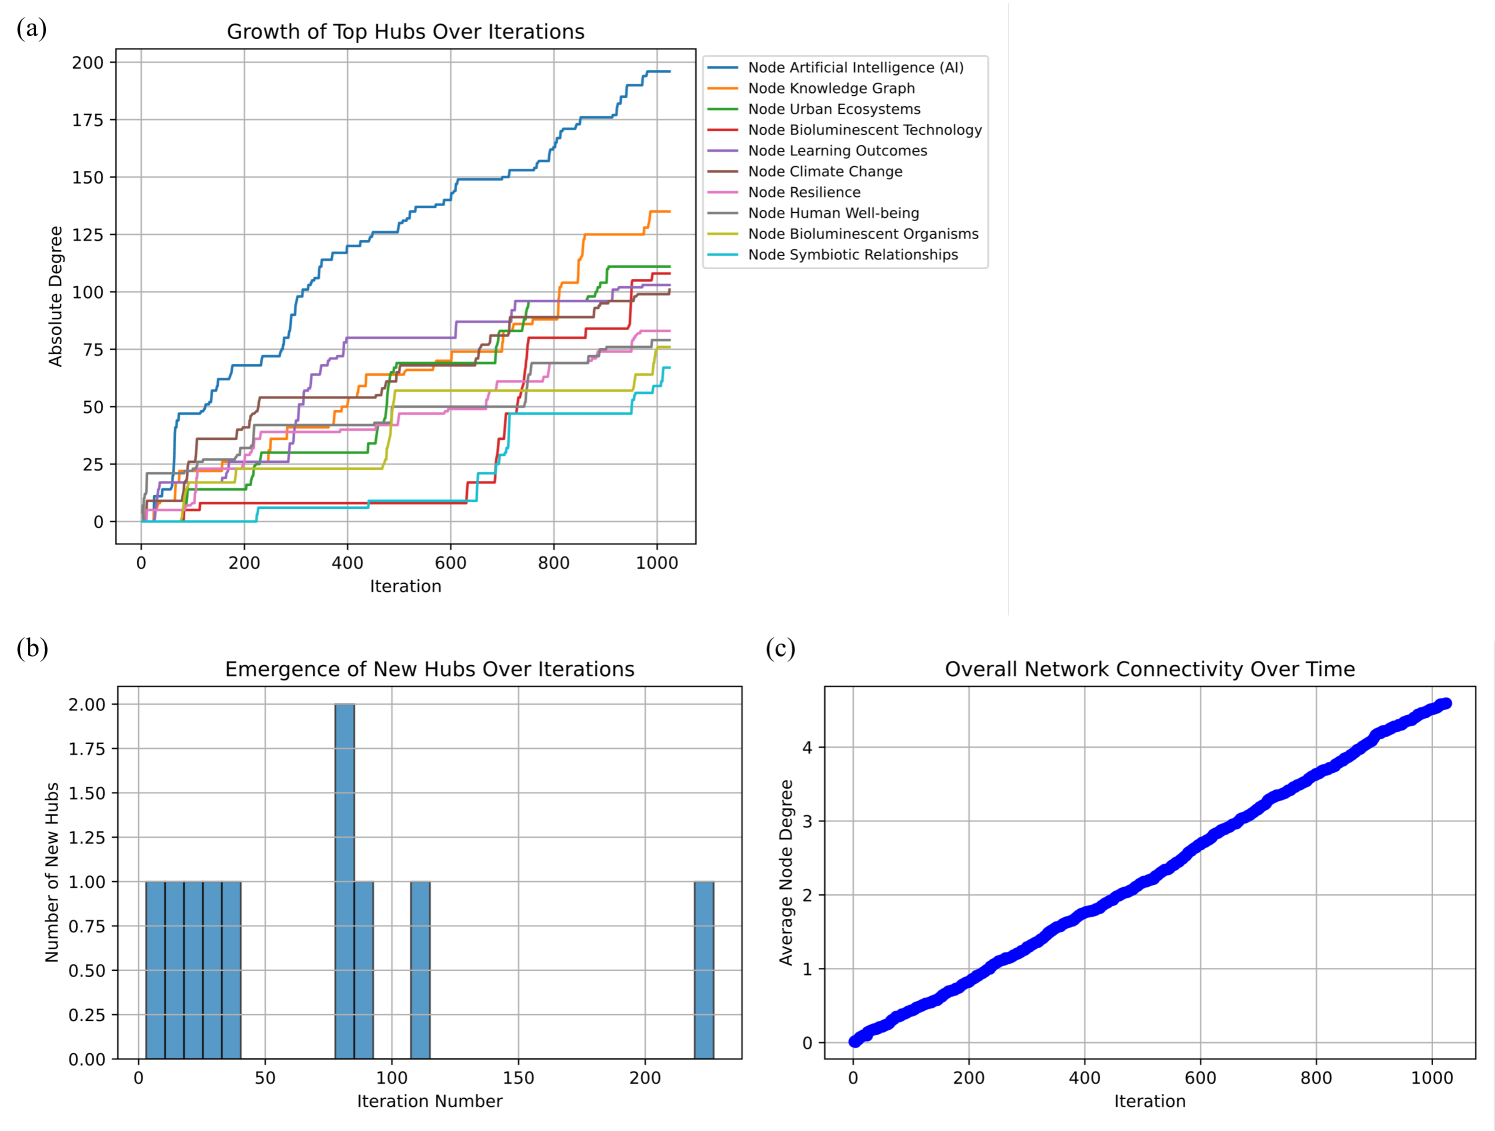
The image contains three subplots analyzing network dynamics across iterations:
1. **(a)** Line chart showing growth of top hubs
2. **(b)** Bar chart displaying new hub emergence
3. **(c)** Line chart tracking network connectivity
### Components/Axes
#### Subplot (a): Growth of Top Hubs Over Iterations
- **X-axis**: Iteration (0-1000, linear scale)
- **Y-axis**: Absolute Degree (0-200, linear scale)
- **Legend**: 10 colored lines representing different node categories:
- Blue: Node Artificial Intelligence (AI)
- Orange: Node Knowledge Graph
- Green: Node Urban Ecosystems
- Red: Node Bioluminescent Technology
- Purple: Node Learning Outcomes
- Brown: Node Climate Change
- Pink: Node Resilience
- Gray: Node Human Well-being
- Yellow: Node Bioluminescent Organisms
- Cyan: Node Symbiotic Relationships
#### Subplot (b): Emergence of New Hubs Over Iterations
- **X-axis**: Iteration Number (0-250, linear scale)
- **Y-axis**: Number of New Hubs (0-2.0, linear scale)
- **Bars**: Blue vertical bars at specific iterations
#### Subplot (c): Overall Network Connectivity Over Time
- **X-axis**: Iteration (0-1000, linear scale)
- **Y-axis**: Average Node Degree (0-4.5, linear scale)
- **Line**: Single blue line representing connectivity metric
### Detailed Analysis
#### Subplot (a) Trends
1. **Node AI (Blue)**: Steepest growth, reaches ~200 absolute degree at 1000 iterations
2. **Node Knowledge Graph (Orange)**: Second-highest growth, ~130 at 1000
3. **Node Urban Ecosystems (Green)**: ~110 at 1000, gradual increase
4. **Node Bioluminescent Technology (Red)**: Sharp rise after 800 iterations (~90→120)
5. **Other Nodes**: All show moderate growth (20-80 range) with varying trajectories
#### Subplot (b) Patterns
- New hubs emerge at iterations: 75 (1.0), 100 (2.0), 125 (1.0), 225 (1.0)
- No new hubs between 150-200 iterations
- Maximum emergence: 2.0 new hubs at iteration 100
#### Subplot (c) Connectivity
- Linear growth from 0.0 to 4.5 average node degree
- Steady increase with no plateaus or declines
- Slope: ~0.0045 degree/iteration
### Key Observations
1. **Dominance of AI Hubs**: Blue line consistently leads in growth rate and final value
2. **Bioluminescent Technology Surge**: Red line shows abrupt growth after 800 iterations
3. **Sporadic New Hub Formation**: Only 4 emergence events in first 250 iterations
4. **Connectivity Correlation**: Subplot (c) suggests hub growth drives network connectivity
### Interpretation
The data demonstrates a network evolution where:
- **AI and Knowledge Graph nodes** become dominant hubs, suggesting central roles in information flow
- **Bioluminescent Technology** emerges as a late-stage growth area, potentially indicating technological breakthroughs
- **Sparse new hub formation** (subplot b) implies network stability with incremental expansion
- **Linear connectivity growth** (subplot c) correlates with hub development, showing network maturation
The visualization suggests a self-reinforcing system where top hubs drive network connectivity, with AI and knowledge infrastructure forming the core architecture. The late-stage surge in bioluminescent technology nodes may represent a paradigm shift in network functionality.