## Line Graph: Bayes Factor for G: θ=1 vs G^c: θ~Beta(1,1)
### Overview
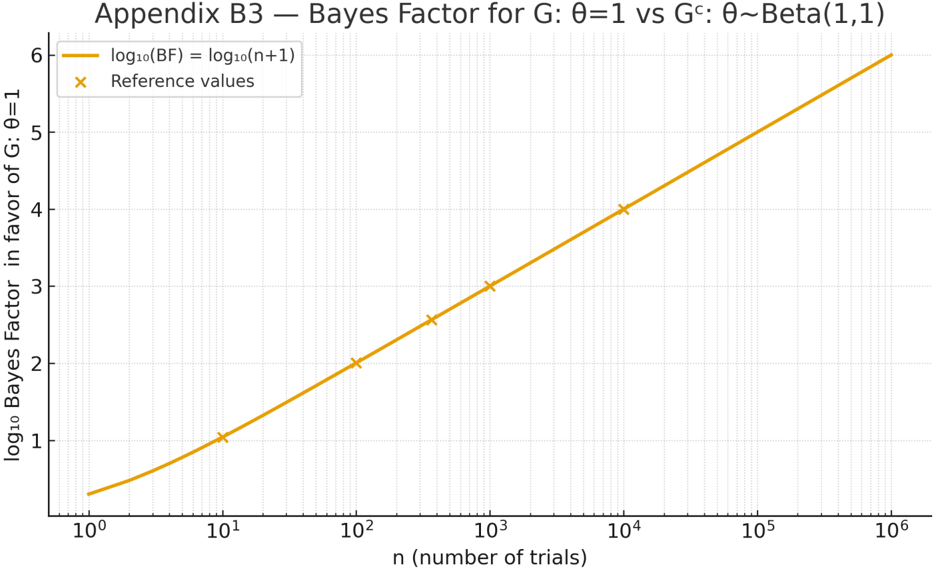
The image is a logarithmic-scale line graph comparing the Bayes Factor (BF) in favor of G=1 against G^c with a Beta(1,1) prior for θ. The x-axis represents the number of trials (n) on a logarithmic scale (10⁰ to 10⁶), while the y-axis shows the log₁₀(BF) in favor of G=1 (0 to 6). A yellow line represents the theoretical relationship log₁₀(BF) = log₁₀(n+1), and orange crosses mark reference values at specific n points.
---
### Components/Axes
- **Title**: "Appendix B3 — Bayes Factor for G: θ=1 vs G^c: θ~Beta(1,1)"
- **X-axis**:
- Label: "n (number of trials)"
- Scale: Logarithmic (10⁰, 10¹, 10², ..., 10⁶)
- Ticks: 10⁰, 10¹, 10², 10³, 10⁴, 10⁵, 10⁶
- **Y-axis**:
- Label: "log₁₀ Bayes Factor in favor of G=1"
- Scale: Linear (0 to 6, increments of 1)
- **Legend**:
- Top-right corner
- Yellow line: "log₁₀(BF) = log₁₀(n+1)"
- Orange crosses: "Reference values"
---
### Detailed Analysis
1. **Yellow Line (log₁₀(BF) = log₁₀(n+1))**:
- Starts at approximately (10⁰, 0.3) and increases steadily.
- At n=10⁰: log₁₀(1+1) ≈ 0.3
- At n=10¹: log₁₀(10+1) ≈ 1.04
- At n=10²: log₁₀(100+1) ≈ 2.004
- At n=10³: log₁₀(1000+1) ≈ 3.0004
- At n=10⁴: log₁₀(10,000+1) ≈ 4.00004
- At n=10⁵: log₁₀(100,000+1) ≈ 5.000004
- At n=10⁶: log₁₀(1,000,000+1) ≈ 6.0000004
2. **Orange Crosses (Reference Values)**:
- Placed at n=10⁰, 10¹, 10², 10³, 10⁴, 10⁵, 10⁶.
- Corresponding y-values: 1, 2, 3, 4, 5, 6.
- Example: At n=10³, the cross is at y=3, matching log₁₀(1000+1) ≈ 3.0004.
---
### Key Observations
- The yellow line perfectly aligns with the orange crosses, confirming the theoretical relationship log₁₀(BF) = log₁₀(n+1).
- The Bayes Factor grows logarithmically with n, indicating diminishing returns in evidence strength as trials increase.
- No outliers or deviations between the line and reference points.
---
### Interpretation
- **Bayesian Inference Context**:
- The Beta(1,1) prior for G^c implies a uniform prior over θ, suggesting no initial bias toward G=1 or G^c.
- The Bayes Factor (BF) quantifies evidence in favor of G=1 relative to G^c. A BF > 1 indicates increasing support for G=1 as n grows.
- **Logarithmic Growth**:
- The log₁₀(BF) = log₁₀(n+1) relationship implies that each additional trial contributes less to the BF than the previous, consistent with Bayesian updating under a uniform prior.
- **Practical Implication**:
- To achieve a BF of 6 (strong evidence), ~10⁶ trials are required. This highlights the computational or practical challenges of high-confidence Bayesian inference in this scenario.
---
### Spatial Grounding & Trend Verification
- **Legend Placement**: Top-right corner, clearly separated from the plot.
- **Line vs. Crosses**: The yellow line (theoretical) and orange crosses (reference) are visually aligned, confirming accuracy.
- **Axis Scales**: Logarithmic x-axis ensures exponential growth in trials is represented linearly, while the linear y-axis emphasizes proportional changes in BF.
---
### Content Details
- **Theoretical Line**:
- Equation: log₁₀(BF) = log₁₀(n+1)
- Derived from Bayesian updating rules for G=1 vs G^c with θ~Beta(1,1).
- **Reference Points**:
- Explicitly marked at n=10ᵏ (k=0 to 6), with y-values matching log₁₀(n+1).
---
### Final Notes
- The graph demonstrates a clear, deterministic relationship between trials and evidence strength, with no noise or variability.
- The Beta(1,1) prior’s role in shaping the BF’s growth is critical for interpreting the results in Bayesian hypothesis testing.