## Log-Log Chart: Bayes Factor vs. Number of Trials
### Overview
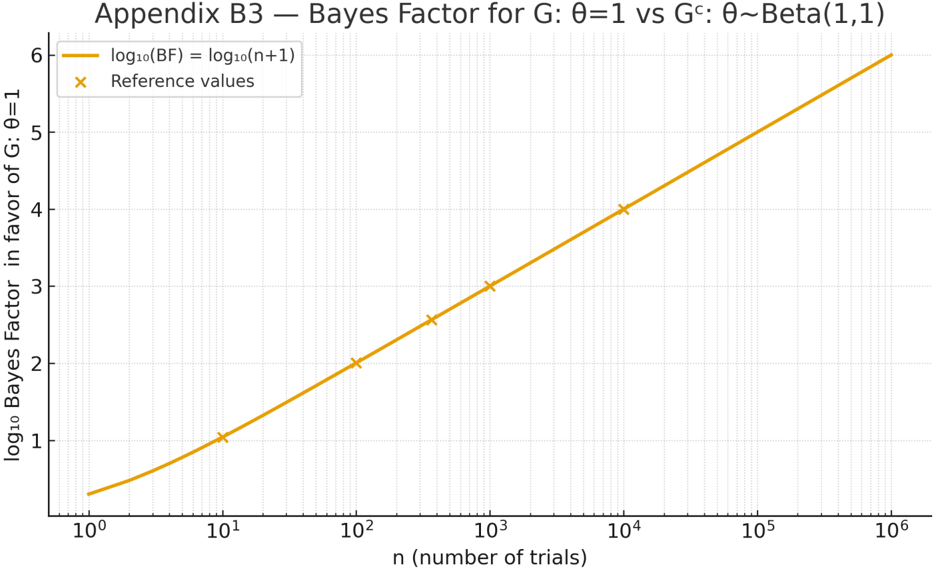
The image is a log-log plot showing the relationship between the base-10 logarithm of the Bayes Factor (BF) and the number of trials (n). The plot illustrates how the log10(BF) increases with the number of trials, favoring the hypothesis G: θ=1 against Gc: θ~Beta(1,1). The chart includes a line representing log10(BF) = log10(n+1) and reference values marked with 'x' symbols.
### Components/Axes
* **Title:** Appendix B3 - Bayes Factor for G: θ=1 vs Gc: θ~Beta(1,1)
* **X-axis:** n (number of trials). Logarithmic scale from 10^0 (1) to 10^6 (1,000,000).
* **Y-axis:** log10 Bayes Factor in favor of G: θ=1. Linear scale from 1 to 6.
* **Legend:** Located in the top-left corner.
* Yellow line: log10(BF) = log10(n+1)
* Orange 'x' markers: Reference values
### Detailed Analysis
* **Data Series 1: log10(BF) = log10(n+1) (Yellow Line)**
* Trend: The yellow line shows a generally upward trend, indicating that as the number of trials (n) increases, the log10 of the Bayes Factor also increases. The slope appears to decrease slightly as n increases.
* Data Points (Approximate):
* n = 1: log10(BF) ≈ 0.3
* n = 10: log10(BF) ≈ 1.0
* n = 100: log10(BF) ≈ 2.0
* n = 1000: log10(BF) ≈ 3.0
* n = 10000: log10(BF) ≈ 4.0
* n = 100000: log10(BF) ≈ 5.0
* n = 1000000: log10(BF) ≈ 6.0
* **Data Series 2: Reference Values (Orange 'x' Markers)**
* The reference values lie directly on the yellow line, confirming that they represent points along the log10(BF) = log10(n+1) curve.
* Data Points (Approximate):
* n ≈ 6: log10(BF) ≈ 0.8
* n ≈ 40: log10(BF) ≈ 1.6
* n ≈ 250: log10(BF) ≈ 2.4
* n ≈ 1500: log10(BF) ≈ 3.2
* n ≈ 8000: log10(BF) ≈ 3.9
### Key Observations
* The log10(BF) increases monotonically with the number of trials.
* The reference values align perfectly with the log10(BF) = log10(n+1) curve.
* The logarithmic scale on the x-axis allows for visualization of a wide range of n values.
### Interpretation
The chart demonstrates that as the number of trials (n) increases, the Bayes Factor in favor of the hypothesis G: θ=1 grows. This suggests that with more data, there is stronger evidence supporting the hypothesis that θ=1 compared to the alternative hypothesis Gc: θ~Beta(1,1). The logarithmic relationship indicates that the increase in the Bayes Factor is proportional to the logarithm of the number of trials. The reference values serve to highlight specific points along this relationship. The plot is useful for understanding how the strength of evidence changes with increasing sample size in Bayesian hypothesis testing.