## Chart: Bayes Factor for G: θ=1 vs Gᶜ: θ~Beta(1,1)
### Overview
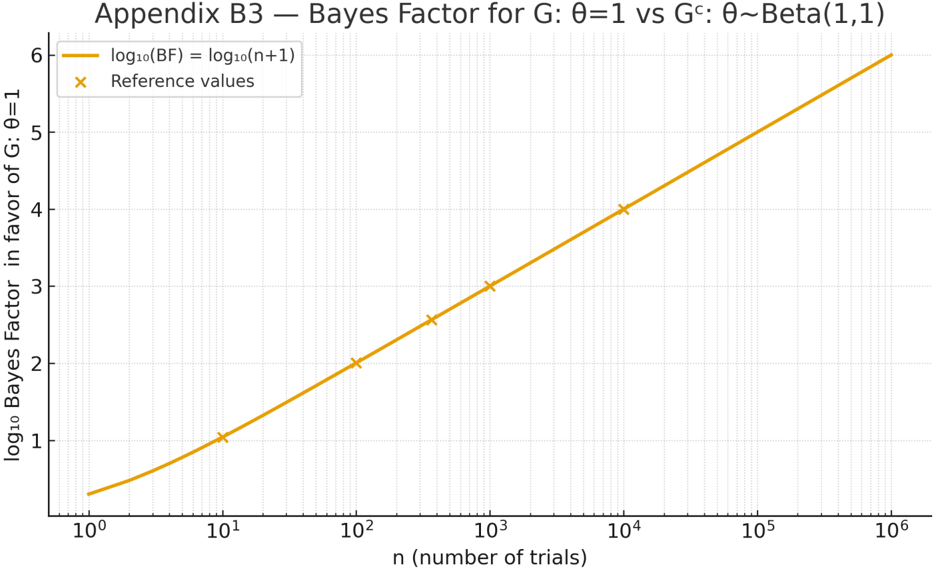
The image presents a chart illustrating the Bayes Factor in favor of G: θ=1 versus Gᶜ: θ~Beta(1,1) as a function of the number of trials (n). The chart displays a continuous line representing the theoretical Bayes Factor and discrete data points representing reference values. The x-axis is logarithmic, and the y-axis also appears to be logarithmic.
### Components/Axes
* **Title:** Appendix B3 – Bayes Factor for G: θ=1 vs Gᶜ: θ~Beta(1,1) (Top-center)
* **X-axis Label:** n (number of trials) (Bottom-center)
* Scale: Logarithmic, ranging from 10⁰ (1) to 10⁶ (1,000,000)
* Markers: 10⁰, 10¹, 10², 10³, 10⁴, 10⁵, 10⁶
* **Y-axis Label:** log₁₀ Bayes Factor in favor of G: θ=1 (Left-center)
* Scale: Logarithmic, ranging from approximately 0.5 to 6.
* Markers: 1, 2, 3, 4, 5, 6
* **Legend:** (Top-right)
* Orange Line: log₁₀(BF) = log₁₀(n+1)
* Orange 'x' Markers: Reference values
### Detailed Analysis
The chart shows two data series: a continuous orange line and discrete orange 'x' markers.
**Orange Line (log₁₀(BF) = log₁₀(n+1))**
* Trend: The line slopes consistently upward, indicating a positive correlation between the number of trials (n) and the log₁₀ Bayes Factor. The slope appears to be relatively constant across the range of n values.
* Data Points (approximate):
* n = 10⁰ (1): log₁₀(BF) ≈ 0.3
* n = 10¹ (10): log₁₀(BF) ≈ 1.0
* n = 10² (100): log₁₀(BF) ≈ 2.0
* n = 10³ (1000): log₁₀(BF) ≈ 3.0
* n = 10⁴ (10000): log₁₀(BF) ≈ 4.0
* n = 10⁵ (100000): log₁₀(BF) ≈ 5.0
* n = 10⁶ (1000000): log₁₀(BF) ≈ 6.0
**Orange 'x' Markers (Reference values)**
* Trend: The markers generally follow the trend of the orange line, but with some deviation.
* Data Points (approximate):
* n ≈ 30: log₁₀(BF) ≈ 1.5
* n ≈ 100: log₁₀(BF) ≈ 2.0
* n ≈ 300: log₁₀(BF) ≈ 2.5
* n ≈ 1000: log₁₀(BF) ≈ 3.0
* n ≈ 3000: log₁₀(BF) ≈ 3.5
* n ≈ 10000: log₁₀(BF) ≈ 4.0
### Key Observations
* The reference values closely approximate the theoretical line, especially at higher values of 'n'.
* The Bayes Factor increases logarithmically with the number of trials.
* The chart demonstrates a clear relationship between sample size and the strength of evidence in favor of the hypothesis G: θ=1.
### Interpretation
The chart illustrates the asymptotic behavior of the Bayes Factor as the number of trials increases. The theoretical line, defined by log₁₀(BF) = log₁₀(n+1), provides a benchmark for the expected Bayes Factor. The reference values, presumably obtained from simulations or empirical data, confirm the theoretical prediction. The logarithmic scale highlights the diminishing returns of increasing the sample size; while the Bayes Factor continues to grow, the rate of growth slows down as 'n' becomes larger. This suggests that, beyond a certain point, increasing the number of trials may not significantly strengthen the evidence in favor of the hypothesis. The chart is useful for understanding the power of Bayesian hypothesis testing and the impact of sample size on the strength of evidence. The fact that the reference values align with the theoretical line suggests the model is a good fit for the observed data.