## Diagram: Hierarchy of Knowledge Types for Neural Network Training
### Overview
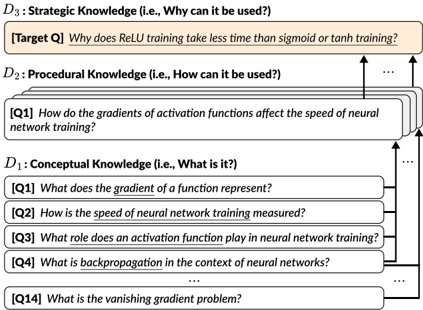
The image is a conceptual diagram illustrating a three-tiered hierarchy of knowledge required to understand and answer a specific technical question about neural network training. The diagram organizes questions into three categories: Conceptual (What is it?), Procedural (How can it be used?), and Strategic (Why can it be used?). Arrows indicate a dependency flow, showing that answering higher-level questions requires understanding the foundational knowledge below.
### Components/Axes
The diagram is structured into three horizontal sections, stacked vertically.
1. **Top Section (D3): Strategic Knowledge (i.e., Why can it be used?)**
* Contains a single, highlighted question box.
* **Label:** `[Target Q]`
* **Text:** `Why does ReLU training take less time than sigmoid or tanh training?`
* **Visual:** This box has a beige/light tan background, distinguishing it as the ultimate target question.
2. **Middle Section (D2): Procedural Knowledge (i.e., How can it be used?)**
* Contains a stack of question boxes, with the top one fully visible and others implied behind it.
* **Label:** `[Q1]`
* **Text:** `How do the gradients of activation functions affect the speed of neural network training?`
* **Visual:** White background boxes. An ellipsis (`...`) to the right indicates additional, non-visible procedural questions.
3. **Bottom Section (D1): Conceptual Knowledge (i.e., What is it?)**
* Contains a stack of question boxes, with four fully visible and others implied.
* **Labels & Text:**
* `[Q1]` `What does the gradient of a function represent?`
* `[Q2]` `How is the speed of neural network training measured?`
* `[Q3]` `What role does an activation function play in neural network training?`
* `[Q4]` `What is backpropagation in the context of neural networks?`
* `...` (Ellipsis indicating more questions)
* `[Q14]` `What is the vanishing gradient problem?`
* **Visual:** White background boxes.
**Flow and Relationships:**
* Black arrows connect the sections, indicating dependency.
* An arrow points from the `D1` stack (specifically from the area of Q1) up to the `D2` question.
* Multiple arrows point from the `D2` stack up to the `D3` target question, signifying that answering the strategic question requires multiple pieces of procedural knowledge.
### Detailed Analysis
The diagram presents a structured learning or reasoning pathway.
* **Conceptual Foundation (D1):** This layer consists of fundamental, definitional questions. It includes 14+ implied questions (`Q1` to `Q14` and beyond) covering core machine learning concepts: gradients, training metrics, activation functions, backpropagation, and the specific problem of vanishing gradients.
* **Procedural Application (D2):** This layer translates concepts into a "how-to" or mechanistic understanding. The visible question (`Q1`) directly links the conceptual understanding of gradients and activation functions (from D1) to their practical impact on a measurable outcome: training speed.
* **Strategic Insight (D3):** This is the apex, a specific, applied "why" question. It seeks a causal explanation for a known empirical observation (ReLU's faster training). The diagram asserts that to answer this, one must first understand the procedural relationship between gradients and speed (D2), which itself depends on the foundational concepts (D1).
### Key Observations
1. **Hierarchical Dependency:** The diagram explicitly models knowledge as layered, with strategic insight built upon procedural knowledge, which is built upon conceptual knowledge.
2. **Target-Driven Structure:** The entire hierarchy is organized to deconstruct and enable the answering of one specific, practical target question (`[Target Q]`).
3. **Non-Linear Complexity:** The ellipses (`...`) in both D1 and D2 indicate that the shown questions are a subset. The full knowledge required is more extensive than what is visually depicted.
4. **Visual Emphasis:** The beige highlighting of the `[Target Q]` box immediately draws the viewer's eye, establishing it as the focal point of the diagram's purpose.
### Interpretation
This diagram is a **knowledge map for technical problem-solving**. It doesn't contain raw data or experimental results but instead models the *cognitive structure* needed to understand a technical phenomenon.
* **What it Demonstrates:** It argues that to explain *why* ReLU is faster (Strategic), you must first understand *how* gradient behavior affects speed (Procedural), which requires knowing *what* gradients, activation functions, and backpropagation are (Conceptual). The vanishing gradient problem (Q14 in D1) is implicitly positioned as a key piece of conceptual knowledge that likely informs the answer to the target question.
* **Relationships:** The arrows represent a logical dependency, not a temporal sequence. One could learn these concepts in any order, but the *explanatory power* flows upward. The multiple arrows from D2 to D3 suggest the strategic answer is multifactorial, relying on several procedural insights.
* **Underlying Assumption:** The diagram assumes a **reductionist and hierarchical approach to technical understanding**. It breaks down a complex "why" question into its constituent "how" and "what" parts. This is a common framework in education and technical analysis, promoting deep understanding over rote memorization.
* **Peircean Investigative Lens:** From a Charles Sanders Peirce perspective, this diagram outlines the path from **abduction** (observing that ReLU is faster - the Target Q) to **deduction** (reasoning through the procedural and conceptual layers to form a hypothesis) and finally to **induction** (which would involve testing that hypothesis with data, a step not shown here). The diagram itself is a tool for organizing abductive and deductive reasoning.