# Technical Document Extraction: Heatmap Analysis of $\phi(A_{r=8}, A_{r=64}, i, j)$
## 1. Document Header Information
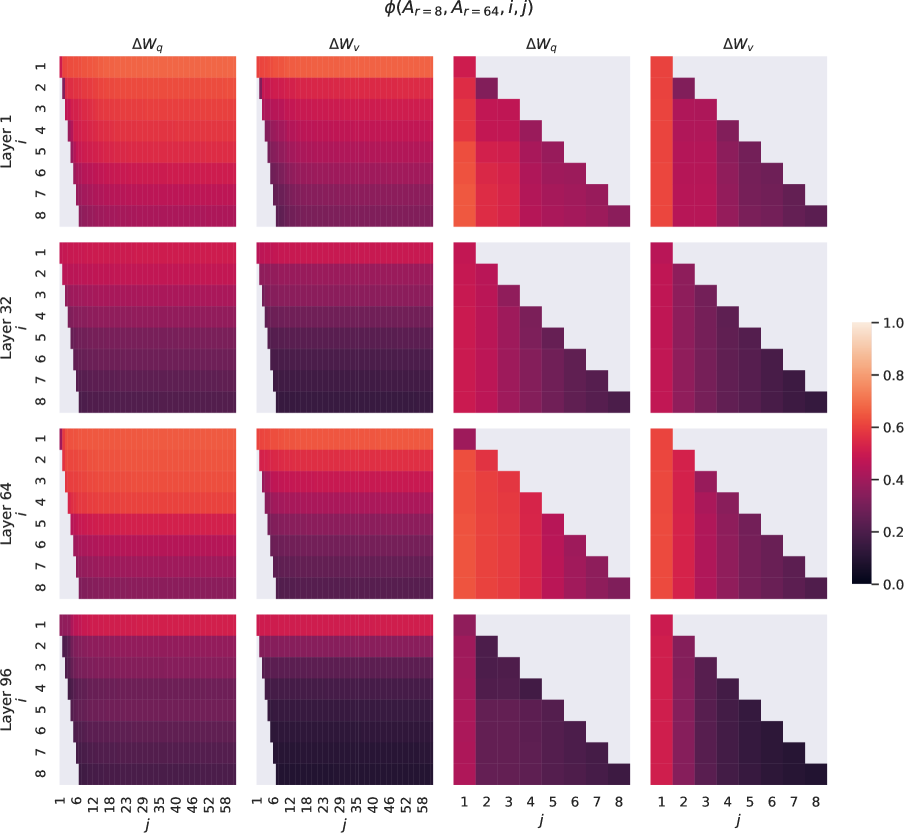
* **Main Title (Mathematical Expression):** $\phi(A_{r=8}, A_{r=64}, i, j)$
* **Image Type:** A grid of 16 heatmaps (4x4 matrix) representing comparative data across different neural network layers and weight update matrices.
## 2. Component Isolation & Structure
The image is organized into a grid with the following dimensions:
* **Vertical Axis (Rows):** Represents different layers of a model.
* Layer 1
* Layer 32
* Layer 64
* Layer 96
* **Horizontal Axis (Columns):** Divided into two main groups, each containing two sub-columns.
* **Group 1 (Columns 1 & 2):** High-resolution $j$ index (1 to 58).
* Sub-column 1: $\Delta W_q$
* Sub-column 2: $\Delta W_v$
* **Group 2 (Columns 3 & 4):** Low-resolution $j$ index (1 to 8).
* Sub-column 3: $\Delta W_q$
* Sub-column 4: $\Delta W_v$
## 3. Legend and Scale
* **Location:** Right-hand side of the image.
* **Type:** Continuous color gradient scale.
* **Range:** 0.0 to 1.0.
* **Color Mapping:**
* **0.0 (Dark Purple/Black):** Low value.
* **0.5 (Magenta/Red):** Mid-range value.
* **1.0 (Light Peach/White):** High value.
* **Light Grey/Blue (Background):** Represents null or masked areas (specifically the upper-right triangles in the rightmost columns).
## 4. Data Extraction: Axis Labels and Markers
### Y-Axis (Common to all rows)
* **Label:** $i$
* **Markers:** 1, 2, 3, 4, 5, 6, 7, 8 (Top to Bottom).
### X-Axis (Group 1: Columns 1 & 2)
* **Label:** $j$
* **Markers:** 1, 6, 12, 18, 23, 29, 35, 40, 46, 52, 58.
### X-Axis (Group 2: Columns 3 & 4)
* **Label:** $j$
* **Markers:** 1, 2, 3, 4, 5, 6, 7, 8.
## 5. Trend Analysis and Heatmap Content
### General Trends
* **Vertical Trend (Layers):** As the layer number increases (from 1 to 96), the overall intensity of the heatmaps decreases (colors shift from lighter oranges/reds to darker purples). Layer 1 shows the highest values, while Layer 96 shows the lowest.
* **Horizontal Trend (Matrices):** $\Delta W_q$ and $\Delta W_v$ show very similar patterns within the same layer and resolution group, though $\Delta W_v$ often appears slightly darker (lower values) than $\Delta W_q$ in the same row.
* **Structural Trend:** In the rightmost columns (j=1 to 8), there is a distinct **lower-triangular pattern**. The values are masked (light grey) where $j > i$.
### Detailed Segment Analysis
| Layer | Matrix Type | Resolution | Visual Trend Description |
| :--- | :--- | :--- | :--- |
| **Layer 1** | $\Delta W_q, \Delta W_v$ | $j \in [1, 58]$ | High intensity (0.6 - 0.9). Values are highest at the top ($i=1$) and gradually darken towards the bottom ($i=8$). |
| **Layer 1** | $\Delta W_q, \Delta W_v$ | $j \in [1, 8]$ | Lower triangular. Values are high (0.7+) along the diagonal and the first column. |
| **Layer 32**| $\Delta W_q, \Delta W_v$ | $j \in [1, 58]$ | Moderate intensity (0.4 - 0.6). Uniform horizontal bands; values decrease slightly as $i$ increases. |
| **Layer 32**| $\Delta W_q, \Delta W_v$ | $j \in [1, 8]$ | Lower triangular. Values are concentrated around 0.4 - 0.5. |
| **Layer 64**| $\Delta W_q, \Delta W_v$ | $j \in [1, 58]$ | Moderate intensity, similar to Layer 32 but with a more pronounced gradient from top to bottom. |
| **Layer 96**| $\Delta W_q, \Delta W_v$ | $j \in [1, 58]$ | Low intensity (0.1 - 0.3). The heatmaps are predominantly dark purple, indicating low correlation or magnitude. |
| **Layer 96**| $\Delta W_q, \Delta W_v$ | $j \in [1, 8]$ | Lower triangular. Very dark; values are mostly near the 0.1 - 0.2 range. |
## 6. Summary of Findings
The visualization demonstrates the behavior of weight updates ($\Delta W$) across different depths of a model. The primary findings are:
1. **Depth Decay:** The values represented by $\phi$ diminish significantly as the model depth increases.
2. **Causal/Triangular Constraint:** The right-hand plots reveal a strict dependency where $i$ must be greater than or equal to $j$ for a value to exist, typical of causal masking in transformer architectures.
3. **Consistency:** The patterns between Query ($q$) and Value ($v$) updates are highly correlated across all layers.