# Technical Document Extraction: Scatter Plot Analysis
## 1. Labels, Axis Titles, and Legends
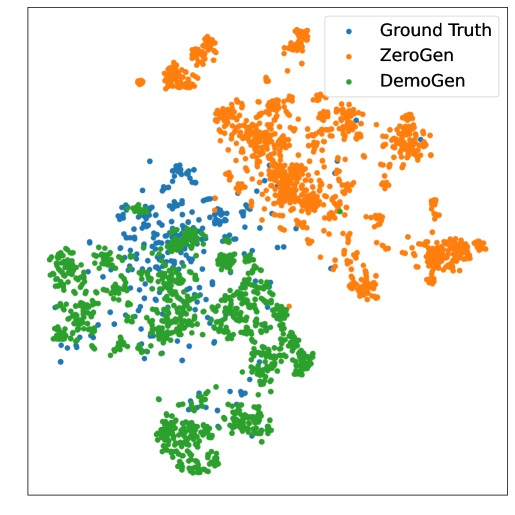
- **Legend**: Located in the **top-right corner** of the plot.
- **Labels**:
- `Ground Truth` (blue circles)
- `ZeroGen` (orange circles)
- `DemoGen` (green circles)
- **Axis Titles**: **No axis labels** are present.
- **Axis Markers**: **No numerical or categorical axis markers** are visible.
## 2. Categories and Sub-Categories
The chart categorizes data into three distinct series:
1. **Ground Truth** (blue):
- Scattered distribution with moderate density.
- Concentrated in the **lower-left quadrant** of the plot.
2. **ZeroGen** (orange):
- High density in the **upper-right quadrant**.
- Points spread across a broader range compared to other series.
3. **DemoGen** (green):
- Dense clustering in the **lower-left quadrant**, overlapping with `Ground Truth`.
- Slightly more compact distribution than `Ground Truth`.
## 3. Text Embedded in Diagrams
- **Legend Text**:
- `Ground Truth` (blue)
- `ZeroGen` (orange)
- `DemoGen` (green)
## 4. Data Table
- **No data table** is present in the image.
## 5. Legend Color-Verification
- **Ground Truth** (blue): Matches all blue data points.
- **ZeroGen** (orange): Matches all orange data points.
- **DemoGen** (green): Matches all green data points.
## 6. Spatial Grounding
- **Legend Position**: Top-right corner (coordinates: `[x_max, y_max]` relative to plot boundaries).
- **Data Point Distribution**:
- `Ground Truth` and `DemoGen` overlap in the lower-left quadrant.
- `ZeroGen` dominates the upper-right quadrant.
## 7. Trend Verification
- **Ground Truth**:
- No clear upward/downward trend; points are dispersed but clustered in the lower-left.
- **ZeroGen**:
- Points trend toward the upper-right quadrant with no discernible linear pattern.
- **DemoGen**:
- Dense clustering in the lower-left quadrant; no significant trend observed.
## 8. Component Isolation
- **Header**: Legend (top-right).
- **Main Chart**: Scatter plot with three overlapping clusters.
- **Footer**: None.
## 9. Critical Observations
- The plot lacks numerical data or axis labels, making quantitative analysis impossible.
- Visual trends suggest:
- `ZeroGen` data diverges spatially from `Ground Truth` and `DemoGen`.
- `DemoGen` approximates `Ground Truth` but with higher density in the lower-left region.
## 10. Language Declaration
- **Primary Language**: English.
- **Translated Text**: No non-English text present.
## Conclusion
The image is a **scatter plot** comparing three data series (`Ground Truth`, `ZeroGen`, `DemoGen`) via spatial distribution. While qualitative trends are evident, the absence of axis labels, numerical data, or a data table limits quantitative interpretation.