\n
## Charts: Probability vs. Injection Volume with Fitting Curves
### Overview
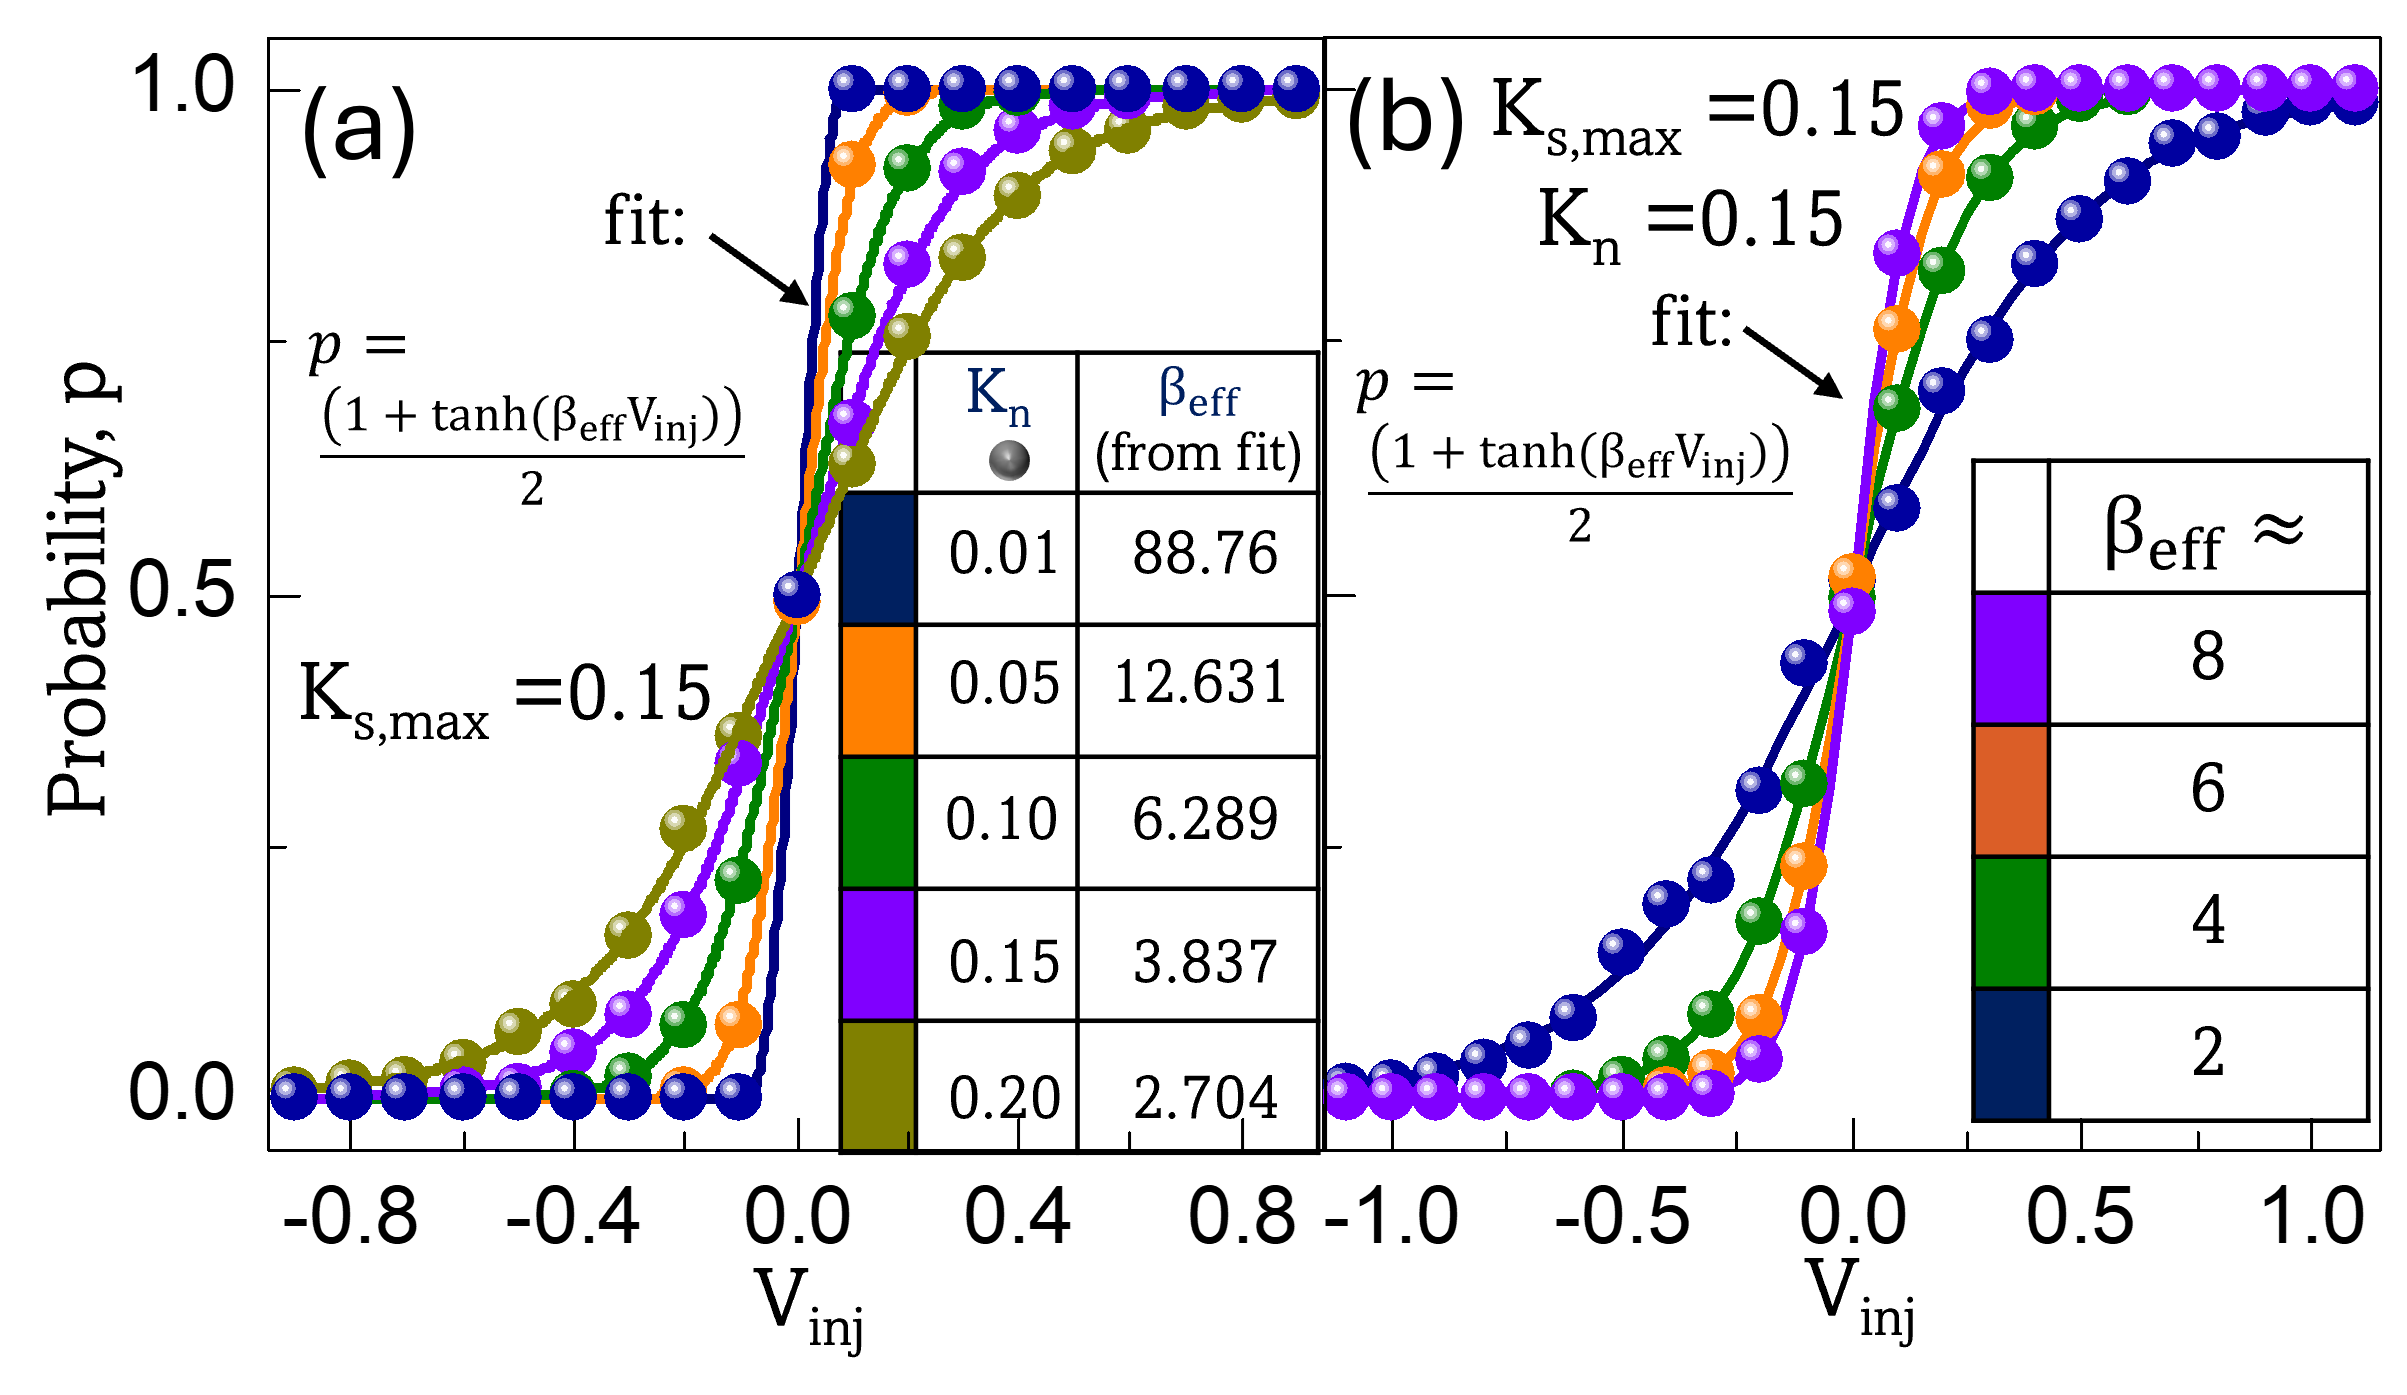
The image presents two charts (labeled (a) and (b)) displaying the relationship between probability (p) and injection volume (Vinj). Both charts include fitted curves and data points, with varying parameters (Kn and βeff). A color-coded table on the right side of chart (b) relates βeff values to a color scale.
### Components/Axes
* **Chart (a):**
* X-axis: Vinj (Injection Volume), ranging from approximately -0.8 to 0.8.
* Y-axis: Probability (p), ranging from 0.0 to 1.0.
* Title: (a)
* Equation: p = (1 + tanh(βeff * Vinj)) / 2
* Ks,max = 0.15 is displayed.
* **Chart (b):**
* X-axis: Vinj (Injection Volume), ranging from approximately -1.0 to 1.0.
* Y-axis: Probability (p), ranging from 0.0 to 1.0.
* Title: (b) Ks,max = 0.15, Kn = 0.15
* Equation: p = (1 + tanh(βeff * Vinj)) / 2
* **Color Table:**
* Title: βeff ≈
* Values: 2, 4, 6, 8
* Color Gradient: Dark Blue -> White -> Red.
* **Legend:** Located in the bottom-left of chart (b).
* Kn: 0.01, βeff (from fit): 88.76 (Dark Blue)
* Kn: 0.05, βeff (from fit): 12.631 (Blue)
* Kn: 0.10, βeff (from fit): 6.289 (Green)
* Kn: 0.15, βeff (from fit): 3.837 (Yellow)
* Kn: 0.20, βeff (from fit): 2.704 (Orange)
### Detailed Analysis or Content Details
**Chart (a):**
* The data points (blue circles) show an S-shaped curve, increasing from approximately 0.0 at Vinj = -0.8 to approximately 1.0 at Vinj = 0.8.
* A fitted curve (orange line) closely follows the data points.
* The curve appears to be centered around Vinj = 0.
* No specific data points are explicitly labeled, but the curve suggests p = 0.5 when Vinj is approximately 0.
**Chart (b):**
* The data points (blue circles) also exhibit an S-shaped curve, similar to chart (a), but with a slightly different range and shape.
* A fitted curve (orange line) closely follows the data points.
* The curve appears to be centered around Vinj = 0.
* The legend indicates different data series corresponding to different Kn values (0.01, 0.05, 0.10, 0.15, 0.20) and their corresponding βeff values obtained from the fit.
* The color of the data points corresponds to the βeff value as indicated in the color table. For example, the data points with Kn = 0.01 (dark blue) correspond to a high βeff value of 88.76.
* The data points for Kn = 0.20 (orange) have a lower βeff value of 2.704.
* The data points for Kn = 0.15 (yellow) have a βeff value of 3.837.
* The data points for Kn = 0.10 (green) have a βeff value of 6.289.
* The data points for Kn = 0.05 (blue) have a βeff value of 12.631.
**Color Table:**
* The color table shows a gradient from dark blue (βeff ≈ 8) to red (βeff ≈ 2).
* The table provides a visual mapping between βeff values and colors.
### Key Observations
* Both charts demonstrate a sigmoidal relationship between probability and injection volume.
* The fitted curves accurately represent the data in both charts.
* Chart (b) shows how the shape of the curve changes with different Kn values, which are correlated with βeff values.
* Higher Kn values (and lower βeff values) result in a flatter S-curve.
* The color table provides a convenient way to visually assess the βeff value associated with each data point.
### Interpretation
The charts likely represent a model of a binary process where the probability of an event occurring (p) depends on the injection volume (Vinj). The parameter βeff controls the steepness of the sigmoid curve, indicating the sensitivity of the process to changes in Vinj. The parameter Kn appears to modulate the overall response.
The data suggests that as Vinj increases, the probability of the event occurring increases rapidly, reaching a saturation point at p = 1.0. The shape of the curve is influenced by the values of Kn and βeff.
The color table allows for a quick visual assessment of the βeff values associated with different data points, providing insights into the sensitivity of the process under different conditions. The relationship between Kn and βeff is inverse, with higher Kn values corresponding to lower βeff values.
The fitted equation p = (1 + tanh(βeff * Vinj)) / 2 is a standard sigmoid function, commonly used to model binary outcomes. The use of this function suggests that the underlying process is likely governed by a threshold effect, where the probability of the event occurring increases sharply once Vinj exceeds a certain threshold.