# Technical Document Extraction: Line Graph Analysis
## Header
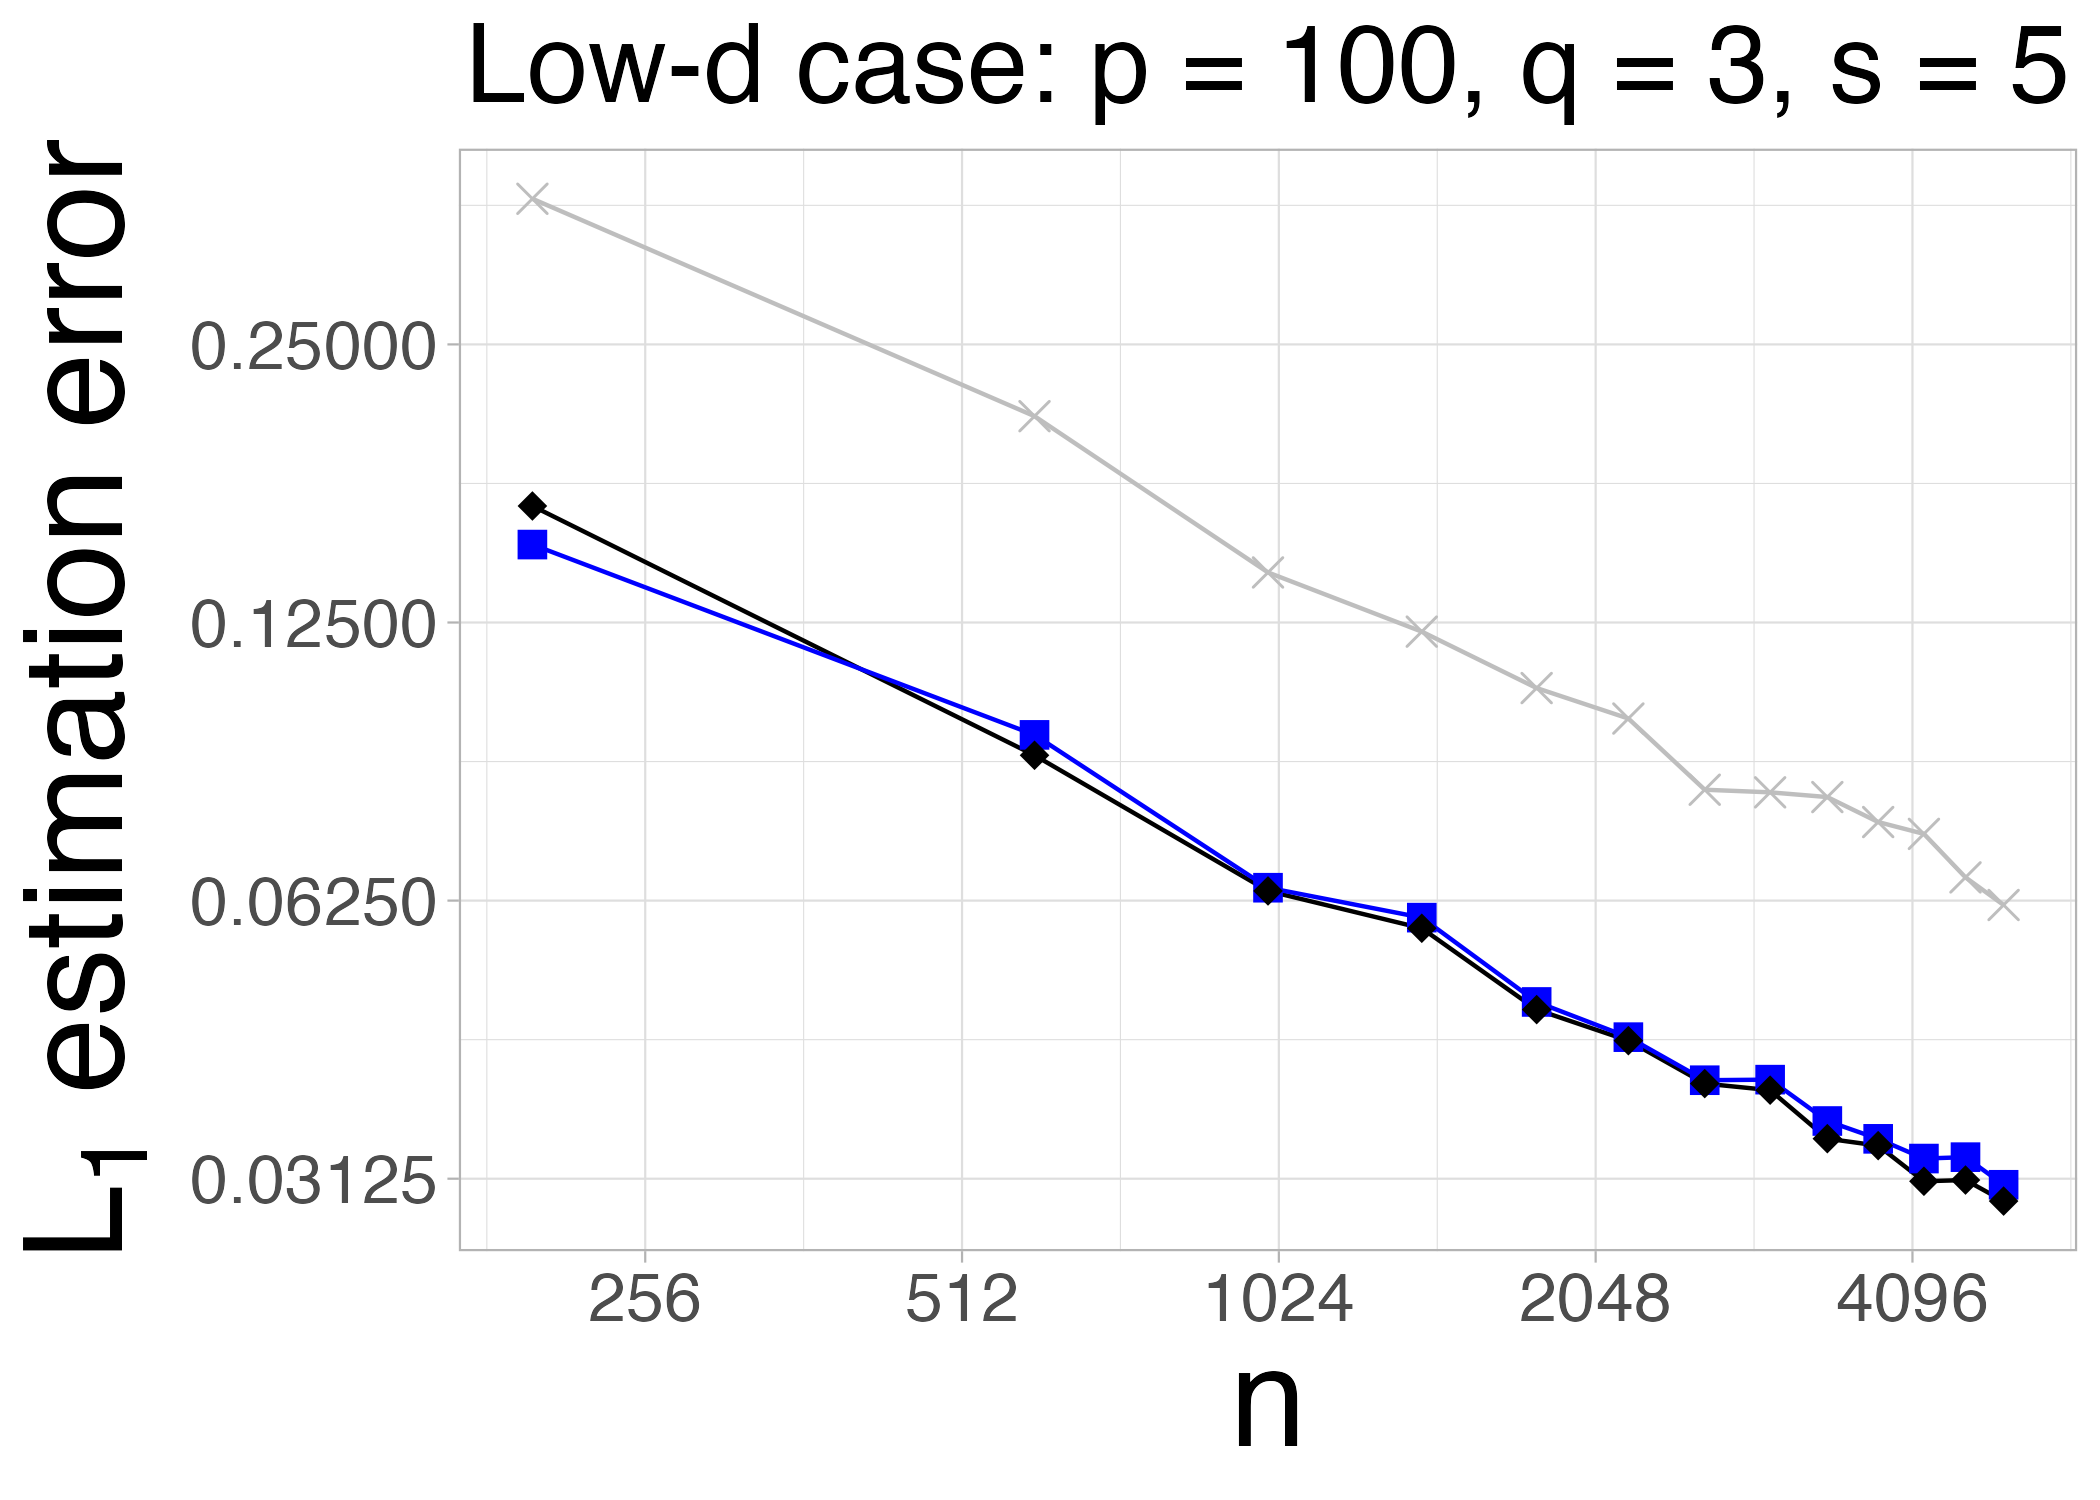
**Title**: Low-d case: p = 100, q = 3, s = 5
## Main Chart
### Axes
- **X-axis (Horizontal)**: Labeled `n` (integer values: 256, 512, 1024, 2048, 4096)
- **Y-axis (Vertical)**: Labeled `L₁ estimation error` (decimal values: 0.03125, 0.06250, 0.12500, 0.25000)
### Data Series
1. **Blue Line with Square Markers**
- **Legend Label**: `q = 3`
- **Trend**: Starts at `L₁ = 0.1375` (n=256), decreases steadily to `L₁ = 0.03125` (n=4096).
- **Key Points**:
- n=256: 0.1375
- n=512: 0.09375
- n=1024: 0.06250
- n=2048: 0.04375
- n=4096: 0.03125
2. **Black Line with Diamond Markers**
- **Legend Label**: `q = 5`
- **Trend**: Starts at `L₁ = 0.28125` (n=256), decreases sharply initially, then plateaus near `L₁ = 0.03125` (n=4096).
- **Key Points**:
- n=256: 0.28125
- n=512: 0.18750
- n=1024: 0.08125
- n=2048: 0.05000
- n=4096: 0.03125
### Legend
- **Location**: Top-right corner of the chart
- **Color-Coding**:
- Blue squares: `q = 3`
- Black diamonds: `q = 5`
### Grid
- **Structure**: Light gray grid lines with darker axis lines
- **Y-axis Ticks**: 0.03125, 0.06250, 0.12500, 0.25000
- **X-axis Ticks**: 256, 512, 1024, 2048, 4096
## Footer
- **No additional text or components**
## Observations
- Both lines exhibit a **monotonic decrease** in `L₁ estimation error` as `n` increases.
- The `q = 5` series (black diamonds) begins with a **steeper decline** compared to `q = 3` (blue squares).
- At `n = 4096`, both series converge to the same `L₁ estimation error` value of `0.03125`.
## Parameters
- `p = 100` (problem dimension)
- `q = 3` and `q = 5` (subproblem sizes)
- `s = 5` (sampling parameter)