### Technical Description of the Box Plot
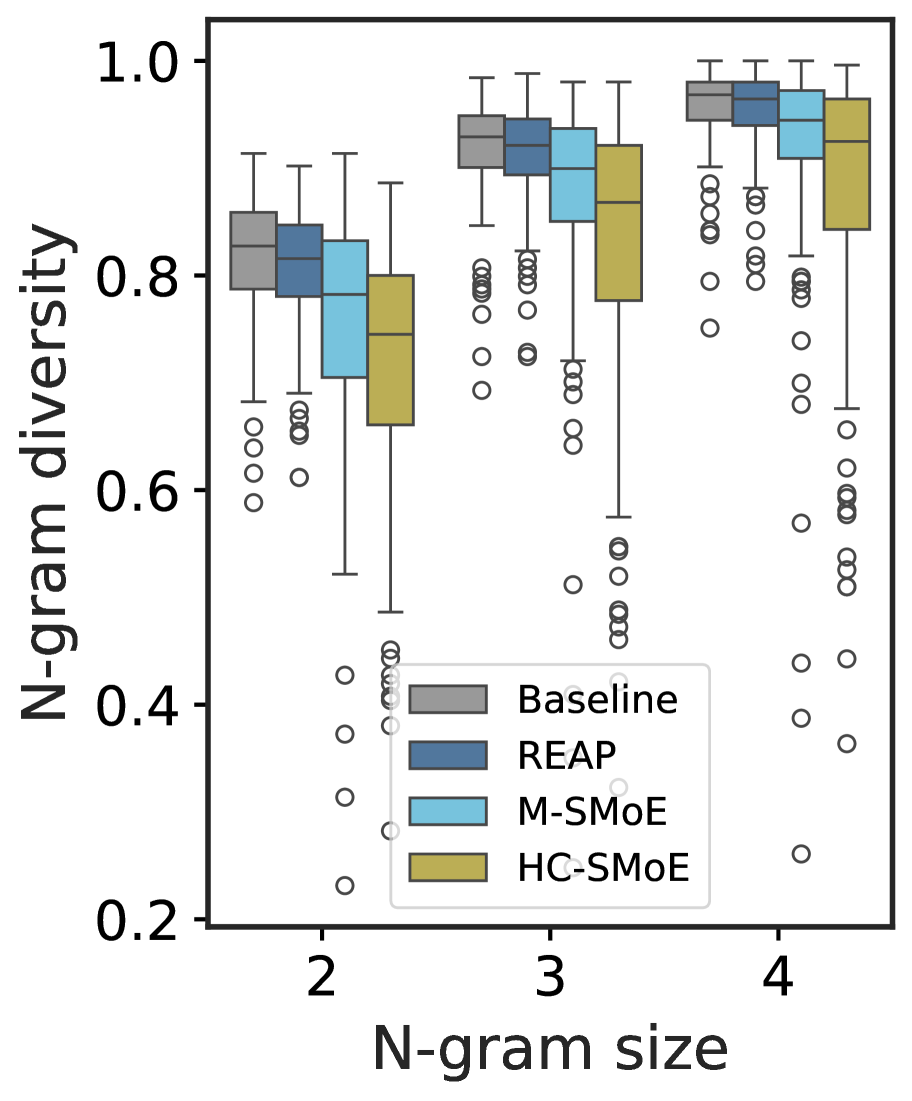
This image is a box plot illustrating the distribution of "N-gram diversity" across different "N-gram size" categories for four distinct models or methods.
#### Axis Information
* **Y-axis:** Labeled "N-gram diversity". The axis is marked with numerical values at intervals of 0.2, specifically: 0.2, 0.4, 0.6, 0.8, and 1.0.
* **X-axis:** Labeled "N-gram size". The axis is marked with three discrete categories: 2, 3, and 4.
#### Legend Information
A legend is located in the bottom center-right of the plot, defining the color coding for the four models:
* **Gray:** Baseline
* **Dark Blue:** REAP
* **Light Blue:** M-SMoE
* **Gold/Yellow:** HC-SMoE
#### Data Analysis by N-gram Size
For each N-gram size (2, 3, and 4), four box plots are presented, corresponding to the four models defined in the legend. Each box plot displays the median, interquartile range (IQR), whiskers (representing the range of the data within 1.5 times the IQR from the quartiles), and individual outlier points (represented by open circles).
**1. N-gram size: 2**
* **Baseline (Gray):** The median is approximately 0.83. The IQR ranges from ~0.79 to ~0.86. Whiskers extend from ~0.68 to ~0.91. Several outliers are present below the lower whisker, down to ~0.59.
* **REAP (Dark Blue):** The median is approximately 0.82. The IQR ranges from ~0.78 to ~0.84. Whiskers extend from ~0.69 to ~0.90. Outliers are present below the lower whisker, down to ~0.61.
* **M-SMoE (Light Blue):** The median is approximately 0.78. The IQR ranges from ~0.70 to ~0.83. Whiskers extend from ~0.52 to ~0.91. Outliers are present below the lower whisker, down to ~0.23.
* **HC-SMoE (Gold):** The median is approximately 0.74. The IQR ranges from ~0.66 to ~0.80. Whiskers extend from ~0.48 to ~0.88. Outliers are present below the lower whisker, down to ~0.28.
**2. N-gram size: 3**
* **Baseline (Gray):** The median is approximately 0.93. The IQR ranges from ~0.90 to ~0.95. Whiskers extend from ~0.84 to ~0.98. Outliers are present below the lower whisker, down to ~0.69.
* **REAP (Dark Blue):** The median is approximately 0.92. The IQR ranges from ~0.89 to ~0.94. Whiskers extend from ~0.84 to ~0.98. Outliers are present below the lower whisker, down to ~0.72.
* **M-SMoE (Light Blue):** The median is approximately 0.89. The IQR ranges from ~0.85 to ~0.93. Whiskers extend from ~0.72 to ~0.98. Outliers are present below the lower whisker, down to ~0.51.
* **HC-SMoE (Gold):** The median is approximately 0.87. The IQR ranges from ~0.78 to ~0.92. Whiskers extend from ~0.58 to ~0.98. Outliers are present below the lower whisker, down to ~0.46.
**3. N-gram size: 4**
* **Baseline (Gray):** The median is approximately 0.97. The IQR ranges from ~0.95 to ~0.98. Whiskers extend from ~0.89 to ~1.0. Outliers are present below the lower whisker, down to ~0.75.
* **REAP (Dark Blue):** The median is approximately 0.96. The IQR ranges from ~0.94 to ~0.98. Whiskers extend from ~0.89 to ~1.0. Outliers are present below the lower whisker, down to ~0.79.
* **M-SMoE (Light Blue):** The median is approximately 0.94. The IQR ranges from ~0.91 to ~0.97. Whiskers extend from ~0.80 to ~1.0. Outliers are present below the lower whisker, down to ~0.26.
* **HC-SMoE (Gold):** The median is approximately 0.92. The IQR ranges from ~0.84 to ~0.96. Whiskers extend from ~0.68 to ~1.0. Outliers are present below the lower whisker, down to ~0.36.
#### Overall Trends
* N-gram diversity generally increases as the N-gram size increases from 2 to 4 for all models.
* For a given N-gram size, the Baseline and REAP models tend to have higher median N-gram diversity compared to M-SMoE and HC-SMoE.
* M-SMoE and HC-SMoE models show a wider range of diversity values (larger IQR and whisker span) and more pronounced outliers, particularly at the lower end of the diversity scale, compared to Baseline and REAP.