# Technical Document Extraction: N-gram Diversity Analysis
## Chart Description
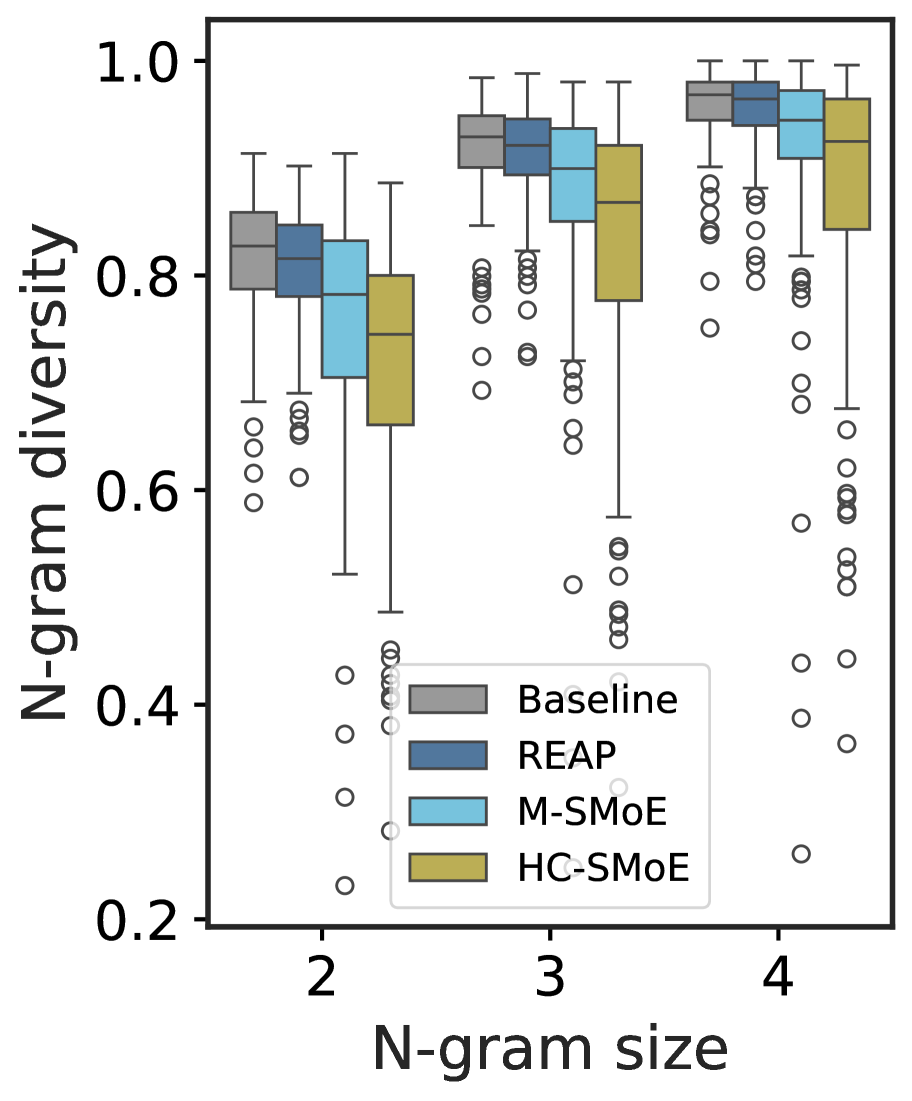
The image presents a comparative box plot analysis of **N-gram diversity** across varying **N-gram sizes** (2, 3, 4) for four computational methods: Baseline, REAP, M-SMoE, and HC-SMoE. The y-axis represents N-gram diversity (0.2–1.0), while the x-axis categorizes data by N-gram size.
---
## Key Components
### Labels & Axis Titles
- **Y-axis**: "N-gram diversity" (scale: 0.2–1.0)
- **X-axis**: "N-gram size" (categories: 2, 3, 4)
- **Legend**:
- Gray: Baseline
- Dark Blue: REAP
- Light Blue: M-SMoE
- Gold: HC-SMoE
### Box Plot Structure
Each box plot includes:
- **Box**: Interquartile range (IQR) of N-gram diversity
- **Median line**: Central tendency within the IQR
- **Whiskers**: Range excluding outliers
- **Outliers**: Represented as open circles
---
## Data Trends
### N-gram Size = 2
- **Baseline**: Median ~0.85 (IQR: ~0.8–0.9)
- **REAP**: Median ~0.82 (IQR: ~0.75–0.85)
- **M-SMoE**: Median ~0.8 (IQR: ~0.75–0.85)
- **HC-SMoE**: Median ~0.75 (IQR: ~0.7–0.8)
### N-gram Size = 3
- **Baseline**: Median ~0.9 (IQR: ~0.85–0.95)
- **REAP**: Median ~0.88 (IQR: ~0.83–0.92)
- **M-SMoE**: Median ~0.85 (IQR: ~0.8–0.9)
- **HC-SMoE**: Median ~0.8 (IQR: ~0.75–0.85)
### N-gram Size = 4
- **Baseline**: Median ~0.92 (IQR: ~0.88–0.95)
- **REAP**: Median ~0.9 (IQR: ~0.85–0.93)
- **M-SMoE**: Median ~0.88 (IQR: ~0.83–0.92)
- **HC-SMoE**: Median ~0.85 (IQR: ~0.8–0.88)
---
## Observations
1. **General Trend**: N-gram diversity decreases as N-gram size increases across all methods.
2. **Method Performance**:
- **Baseline** consistently achieves the highest median diversity.
- **HC-SMoE** exhibits the lowest median diversity but comparable spread to other methods.
- **REAP** and **M-SMoE** show intermediate performance, with REAP slightly outperforming M-SMoE in larger N-gram sizes.
3. **Outliers**: Scattered outliers (open circles) indicate variability in individual data points, particularly for N=2 and N=4.
---
## Transcribed Text
- **Legend Labels**:
- Baseline
- REAP
- M-SMoE
- HC-SMoE
- **Axis Markers**:
- Y-axis ticks: 0.2, 0.4, 0.6, 0.8, 1.0
- X-axis ticks: 2, 3, 4
---
## Conclusion
The chart demonstrates that larger N-gram sizes correlate with reduced diversity, with the Baseline method maintaining the highest performance. HC-SMoE underperforms relative to other methods, suggesting potential limitations in its N-gram handling strategy.