## Multi-Panel Scatter Plot: Network Growth Metrics
### Overview
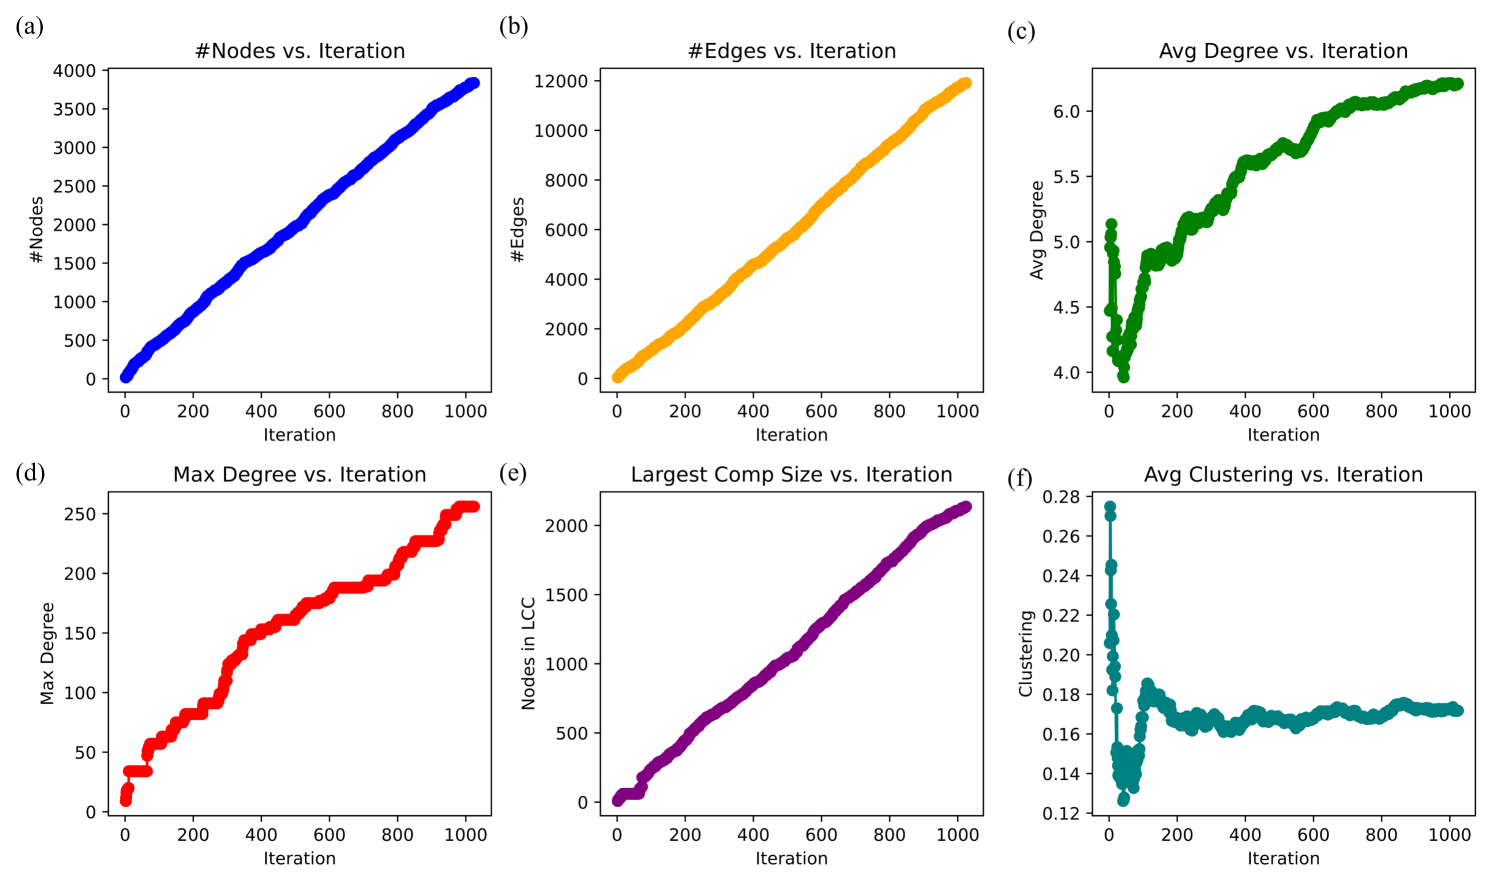
The image presents a 2x3 grid of six scatter plots, labeled (a) through (f). These charts visualize the evolution of various topological metrics of a network over 1000 iterations. Each plot tracks a specific metric on the Y-axis against the "Iteration" count on the X-axis. The data suggests a simulation of a growing network model, likely involving preferential attachment or a similar generative process.
### Components/Axes
All six plots share the same X-axis: **Iteration**, ranging from 0 to 1000.
* **(a) #Nodes vs. Iteration (Top-Left):**
* Y-axis: "#Nodes", scale 0 to 4000.
* Color: Blue.
* **(b) #Edges vs. Iteration (Top-Center):**
* Y-axis: "#Edges", scale 0 to 12000.
* Color: Orange.
* **(c) Avg Degree vs. Iteration (Top-Right):**
* Y-axis: "Avg Degree", scale 4.0 to 6.0.
* Color: Green.
* **(d) Max Degree vs. Iteration (Bottom-Left):**
* Y-axis: "Max Degree", scale 0 to 250.
* Color: Red.
* **(e) Largest Comp Size vs. Iteration (Bottom-Center):**
* Y-axis: "Nodes in LCC" (Largest Connected Component), scale 0 to 2000.
* Color: Purple.
* **(f) Avg Clustering vs. Iteration (Bottom-Right):**
* Y-axis: "Clustering", scale 0.12 to 0.28.
* Color: Teal.
---
### Detailed Analysis
#### (a) #Nodes vs. Iteration
* **Trend:** A consistent, linear upward slope.
* **Data Points:** Starts at 0 at iteration 0. It increases steadily, reaching approximately 3800 nodes by iteration 1000.
#### (b) #Edges vs. Iteration
* **Trend:** A consistent, linear upward slope, mirroring the node growth.
* **Data Points:** Starts at 0. It increases steadily, reaching approximately 12000 edges by iteration 1000.
#### (c) Avg Degree vs. Iteration
* **Trend:** High volatility in the first 200 iterations, followed by a steady, slightly concave-downward growth.
* **Data Points:**
* Initial phase (0-100 iterations): A sharp spike to ~5.1, followed by a drop to ~4.0.
* Growth phase (100-1000 iterations): A gradual increase from ~4.0 to ~6.2.
#### (d) Max Degree vs. Iteration
* **Trend:** A step-like, non-linear growth pattern.
* **Data Points:**
* Starts at ~10-20.
* Shows distinct "plateaus" followed by sharp jumps, indicating the emergence of new "hubs" or the expansion of existing ones.
* Reaches a maximum of approximately 250-260 by iteration 1000.
#### (e) Largest Comp Size vs. Iteration
* **Trend:** Linear upward slope.
* **Data Points:** Starts at 0. It grows consistently, reaching approximately 2100-2200 nodes in the Largest Connected Component (LCC) by iteration 1000.
#### (f) Avg Clustering vs. Iteration
* **Trend:** Extreme volatility in the first 200 iterations, followed by stabilization.
* **Data Points:**
* Initial phase (0-100 iterations): A sharp spike to ~0.275, followed by a sharp drop to ~0.13.
* Stabilization phase (200-1000 iterations): The value oscillates within a narrow band between ~0.16 and ~0.175.
---
### Key Observations
* **Linearity vs. Complexity:** While the total count of nodes and edges (a, b) and the LCC size (e) grow linearly, the structural properties (Avg Degree, Max Degree, Clustering) exhibit non-linear, complex behaviors.
* **Early Instability:** Panels (c) and (f) demonstrate that the network's structural properties are highly unstable during the initial formation (iterations 0-200). This is typical for small networks where the addition of a single edge significantly alters the global topology.
* **Hub Formation:** The step-like progression in (d) Max Degree is a hallmark of preferential attachment models, where the network periodically creates or expands a central hub.
* **LCC Discrepancy:** Comparing (a) and (e), the total node count is ~3800, but the LCC is only ~2200. This indicates that a significant portion of the network (roughly 40%) exists outside the largest connected component, suggesting the presence of many smaller, disconnected components or isolated nodes.
### Interpretation
The data suggests a simulation of a **growing network model** (likely a variation of the Barabási-Albert model or a similar stochastic graph generator).
1. **Growth Regime:** The linear growth in nodes and edges indicates a constant rate of network expansion.
2. **Structural Maturation:** The stabilization of the Average Clustering (f) and the steady growth of the Average Degree (c) after iteration 200 suggest that the network reaches a "steady state" or "scale-free" regime. The initial volatility is simply the "burn-in" period of the simulation.
3. **Connectivity:** The fact that the LCC (e) is smaller than the total node count (a) implies that the network is not fully connected. The growth process likely generates new nodes that do not always attach to the main component, or it creates isolated clusters that have not yet merged with the LCC.
4. **Hub Dynamics:** The Max Degree (d) plot confirms that the network is "hub-centric." The step-like increases represent moments where a node becomes significantly more connected than others, reinforcing the "rich-get-richer" phenomenon characteristic of preferential attachment.