TECHNICAL ASSET FINGERPRINT
f8bb5d750af0d0d760762947
Click to view fullscreen
Press ESC or click to close
FOUND IN PAPERS
EXPERT: gemini-3.1-pro-preview VERSION 1
RUNTIME: gemini/gemini-3.1-pro-preview
INTEL_VERIFIED
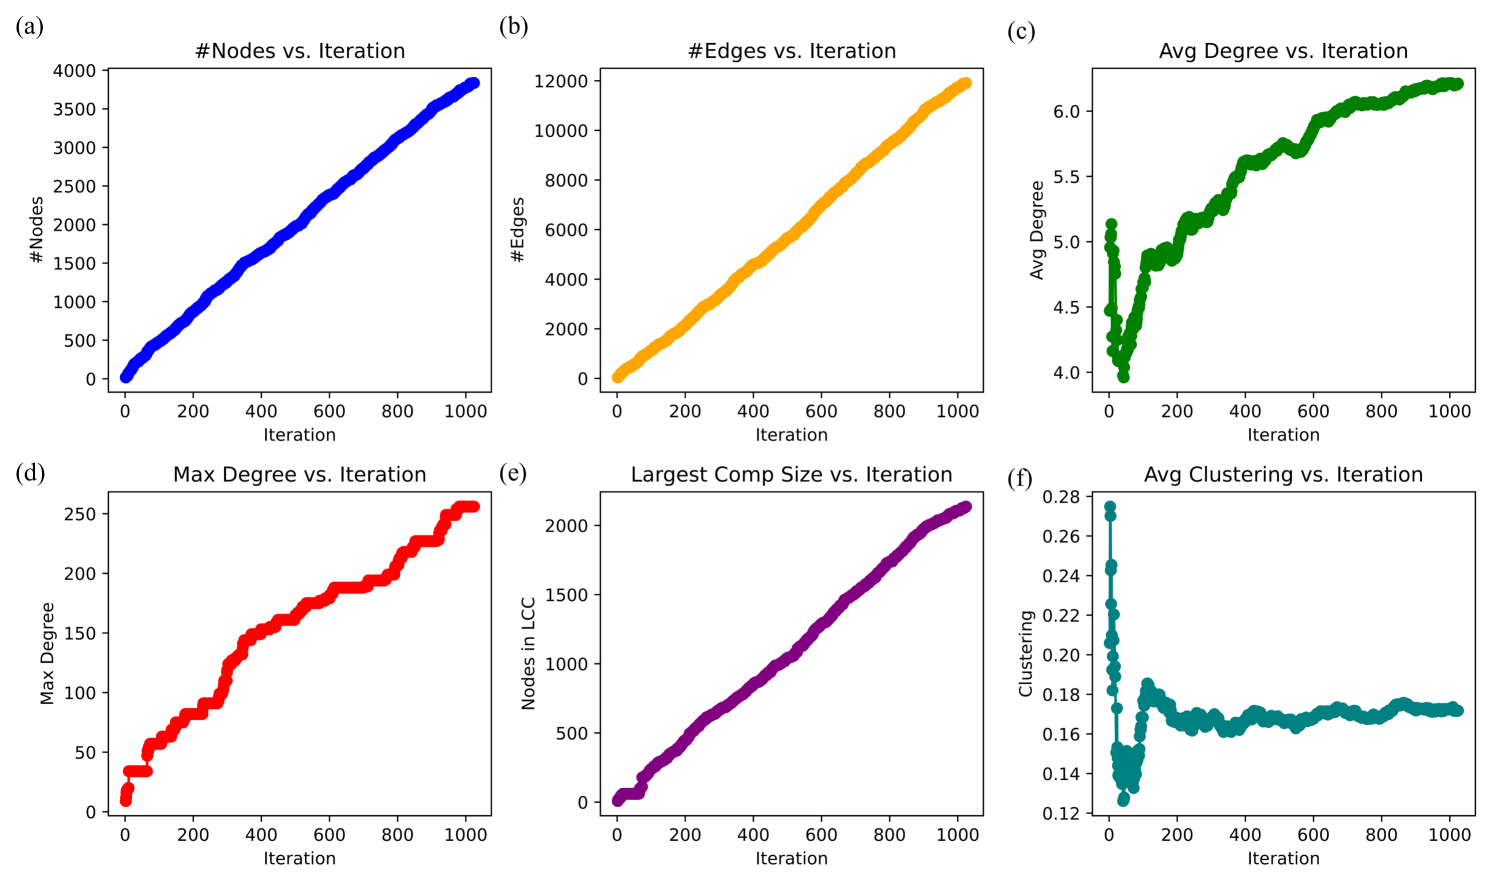
## Line Charts: Network Evolution Metrics over Iterations
### Overview
The image consists of a 2x3 grid of line charts, labeled (a) through (f). These charts display the evolution of various graph/network topological metrics over a series of iterations. The primary language used in the image is English; no other languages are present. All six charts share a common X-axis metric ("Iteration") but track different Y-axis variables, each represented by a distinct color. There are no explicit legend boxes; instead, the title and Y-axis label of each subplot define the data series.
### Components/Axes
**Shared X-Axis (All Plots):**
* **Label:** Iteration
* **Scale:** Linear, ranging from 0 to 1000.
* **Markers:** Major tick marks at 0, 200, 400, 600, 800, and 1000.
**Individual Y-Axes and Spatial Grounding:**
* **Top-Left - Plot (a):**
* **Title:** #Nodes vs. Iteration
* **Y-Axis Label:** #Nodes
* **Scale:** 0 to 4000, increments of 500.
* **Color:** Blue
* **Top-Center - Plot (b):**
* **Title:** #Edges vs. Iteration
* **Y-Axis Label:** #Edges
* **Scale:** 0 to 12000, increments of 2000.
* **Color:** Orange/Yellow
* **Top-Right - Plot (c):**
* **Title:** Avg Degree vs. Iteration
* **Y-Axis Label:** Avg Degree
* **Scale:** 4.0 to 6.0, increments of 0.5.
* **Color:** Green
* **Bottom-Left - Plot (d):**
* **Title:** Max Degree vs. Iteration
* **Y-Axis Label:** Max Degree
* **Scale:** 0 to 250, increments of 50.
* **Color:** Red
* **Bottom-Center - Plot (e):**
* **Title:** Largest Comp Size vs. Iteration
* **Y-Axis Label:** Nodes in LCC (Largest Connected Component)
* **Scale:** 0 to 2000, increments of 500.
* **Color:** Purple
* **Bottom-Right - Plot (f):**
* **Title:** Avg Clustering vs. Iteration
* **Y-Axis Label:** Clustering
* **Scale:** 0.12 to 0.28, increments of 0.02.
* **Color:** Teal/Dark Cyan
### Detailed Analysis
**Plot (a) - #Nodes (Top-Left, Blue Line):**
* **Trend Verification:** The blue line slopes upward in a strictly linear fashion from the origin to the top right.
* **Data Points:** The network starts at approximately 0 nodes at iteration 0. It grows steadily, reaching exactly 2000 nodes at iteration ~520, and concludes at approximately 3800 nodes at iteration 1000.
**Plot (b) - #Edges (Top-Center, Orange Line):**
* **Trend Verification:** Similar to nodes, the orange line exhibits a strictly linear upward slope.
* **Data Points:** Starting near 0 edges at iteration 0, the edge count increases rapidly and consistently, reaching approximately 6000 edges at iteration 500, and finishing near 12,000 edges at iteration 1000.
**Plot (c) - Avg Degree (Top-Right, Green Line):**
* **Trend Verification:** The green line shows high initial volatility. It drops sharply, then reverses into a steady, slightly fluctuating upward curve that begins to plateau near the end.
* **Data Points:** At iteration 0, the average degree starts high at ~5.1. It immediately plummets to a minimum of ~4.0 around iteration 50. From there, it climbs steadily, crossing 5.0 at iteration ~250, and ends at approximately 6.2 at iteration 1000.
**Plot (d) - Max Degree (Bottom-Left, Red Line):**
* **Trend Verification:** The red line displays a step-wise, monotonically increasing trend. It features periods of rapid growth interspersed with flat plateaus.
* **Data Points:** Starting at ~10 at iteration 0, it jumps to ~30 quickly. A notable rapid ascent occurs between iterations 250 and 350 (jumping from ~90 to ~150). Another steep climb happens around iteration 800. The maximum degree reaches approximately 260 by iteration 1000.
**Plot (e) - Largest Comp Size (Bottom-Center, Purple Line):**
* **Trend Verification:** The purple line slopes upward linearly, closely mirroring the trend in Plot (a), though with a very brief flat period at the very beginning.
* **Data Points:** Starting near 0, it stays flat for roughly the first 50 iterations, then grows linearly. It reaches ~1000 nodes at iteration 500 and concludes at approximately 2150 nodes at iteration 1000.
**Plot (f) - Avg Clustering (Bottom-Right, Teal Line):**
* **Trend Verification:** The teal line shows extreme early volatility before settling into a stable, horizontal band with minor oscillations.
* **Data Points:** The clustering coefficient starts at its peak of ~0.275 at iteration 0. It crashes dramatically to a low of ~0.125 around iteration 50. It rebounds to ~0.18 by iteration 120, and for the remaining 800+ iterations, it oscillates tightly between ~0.16 and ~0.175.
### Key Observations
1. **Linear Growth in Size:** Both the number of nodes (a) and the number of edges (b) grow at a constant linear rate. However, edges grow much faster than nodes (reaching 12,000 vs. 3,800).
2. **Initialization Phase ("Burn-in"):** Plots (c) Avg Degree and (f) Avg Clustering show a distinct "burn-in" phase during the first 50-100 iterations. The metrics are highly unstable before the network reaches a critical mass, after which structural properties stabilize or follow predictable curves.
3. **Step-wise Hub Formation:** The Max Degree (d) does not grow smoothly. The step-wise pattern indicates that specific nodes (hubs) acquire connections in bursts, or that the algorithm driving the network evolution operates in discrete phases.
4. **Component Ratio:** By comparing (a) and (e), at iteration 1000, there are ~3800 total nodes, and the Largest Connected Component contains ~2150 nodes. This means roughly 56% of the network belongs to a single giant component.
### Interpretation
These charts almost certainly depict the execution of a **generative network algorithm** or a simulation of network evolution over time (e.g., a modified Barabási–Albert model or similar preferential attachment simulation).
* **Mathematical Consistency Check:** We can cross-reference the data to prove internal consistency. The formula for Average Degree in an undirected graph is `(2 * Total Edges) / Total Nodes`.
* At iteration 1000, Total Edges $\approx$ 12,000 (from plot b).
* At iteration 1000, Total Nodes $\approx$ 3,800 (from plot a).
* Calculation: `(2 * 12000) / 3800` $\approx$ `24000 / 3800` $\approx$ **6.31**.
* Looking at Plot (c), the Average Degree at iteration 1000 is indeed just above 6.0 (approximately 6.2). This confirms the data across the subplots is mathematically linked and accurate.
* **Network Dynamics:** The linear addition of nodes and edges suggests a constant growth rate. Because edges are added at a higher rate than nodes, the network becomes increasingly dense over time, which is reflected in the rising Average Degree (c).
* **Structural Maturation:** The dramatic drop in Average Clustering (f) at the beginning suggests the simulation starts with a very small, tightly knit "seed" graph (which naturally has high clustering). As new nodes are added linearly, they dilute this initial tight structure, causing the clustering coefficient to plummet. However, as the network matures past iteration 200, it finds an equilibrium, maintaining a steady clustering coefficient of ~0.17 despite continuous growth.
* **Hubs and Inequality:** The Max Degree (d) reaching 260 in a network of 3800 nodes (where the average degree is only ~6) indicates a heavy-tailed degree distribution. A few nodes are highly connected "hubs." The step-wise nature of this growth suggests that once a node becomes a hub, it experiences periods of rapid connection acquisition, a hallmark of "rich-get-richer" network dynamics.
DECODING INTELLIGENCE...