## Charts: Network Growth Metrics vs. Iteration
### Overview
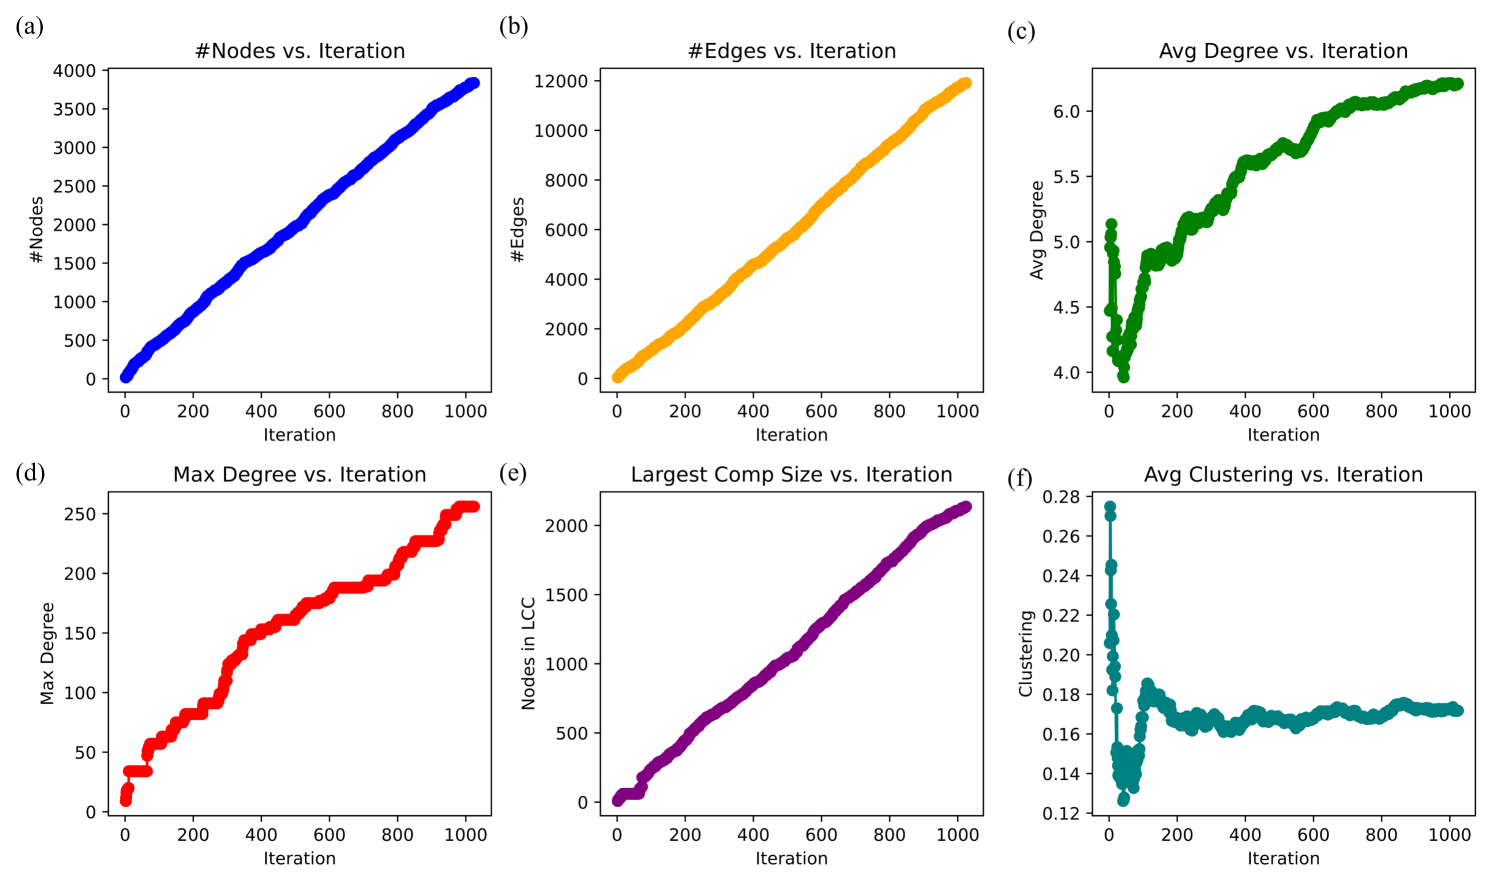
The image presents six separate line charts, each depicting the evolution of a different network metric as a function of iteration. The metrics tracked are: Number of Nodes, Number of Edges, Average Degree, Maximum Degree, Largest Component Size, and Average Clustering Coefficient. All charts share a common x-axis representing "Iteration" ranging from 0 to 1000.
### Components/Axes
Each chart has the following components:
* **X-axis:** "Iteration" (0 to 1000)
* **Y-axis:** Varies depending on the chart (see below)
* **Line:** Represents the metric's value over iterations. Each line has a distinct color.
The specific Y-axis labels are:
* (a) "#Nodes vs. Iteration": "#Nodes" (0 to 4000)
* (b) "#Edges vs. Iteration": "#Edges" (0 to 12000)
* (c) "Avg Degree vs. Iteration": "Avg Degree" (4.0 to 6.0)
* (d) "Max Degree vs. Iteration": "Max Degree" (0 to 250)
* (e) "Largest Comp Size vs. Iteration": "Nodes in LCC" (0 to 2000)
* (f) "Avg Clustering vs. Iteration": "Clustering" (0.12 to 0.28)
The lines are colored as follows:
* (a) Blue
* (b) Orange
* (c) Green
* (d) Red
* (e) Purple
* (f) Teal
### Detailed Analysis
**(a) #Nodes vs. Iteration (Blue Line)**
The blue line shows a consistently upward trend, indicating a steady increase in the number of nodes with each iteration.
* Iteration 0: Approximately 0 nodes
* Iteration 200: Approximately 800 nodes
* Iteration 400: Approximately 1600 nodes
* Iteration 600: Approximately 2400 nodes
* Iteration 800: Approximately 3200 nodes
* Iteration 1000: Approximately 4000 nodes
**(b) #Edges vs. Iteration (Orange Line)**
The orange line also exhibits an upward trend, but it appears to be steeper than the node growth.
* Iteration 0: Approximately 0 edges
* Iteration 200: Approximately 2000 edges
* Iteration 400: Approximately 4000 edges
* Iteration 600: Approximately 6000 edges
* Iteration 800: Approximately 8000 edges
* Iteration 1000: Approximately 12000 edges
**(c) Avg Degree vs. Iteration (Green Line)**
The green line initially decreases, then plateaus and slightly increases.
* Iteration 0: Approximately 5.2
* Iteration 200: Approximately 4.2
* Iteration 400: Approximately 4.5
* Iteration 600: Approximately 5.0
* Iteration 800: Approximately 5.5
* Iteration 1000: Approximately 5.8
**(d) Max Degree vs. Iteration (Red Line)**
The red line shows a strong upward trend, indicating that the maximum degree in the network increases significantly with each iteration.
* Iteration 0: Approximately 10
* Iteration 200: Approximately 80
* Iteration 400: Approximately 140
* Iteration 600: Approximately 180
* Iteration 800: Approximately 220
* Iteration 1000: Approximately 250
**(e) Largest Comp Size vs. Iteration (Purple Line)**
The purple line shows a steady increase, similar to the number of nodes.
* Iteration 0: Approximately 0 nodes
* Iteration 200: Approximately 400 nodes
* Iteration 400: Approximately 800 nodes
* Iteration 600: Approximately 1200 nodes
* Iteration 800: Approximately 1600 nodes
* Iteration 1000: Approximately 2000 nodes
**(f) Avg Clustering vs. Iteration (Teal Line)**
The teal line initially decreases rapidly, then levels off and shows a slight increase.
* Iteration 0: Approximately 0.26
* Iteration 200: Approximately 0.18
* Iteration 400: Approximately 0.16
* Iteration 600: Approximately 0.15
* Iteration 800: Approximately 0.14
* Iteration 1000: Approximately 0.14
### Key Observations
* The number of nodes and edges consistently increase with iteration.
* The average degree initially decreases but stabilizes and slightly increases.
* The maximum degree increases significantly with iteration.
* The largest component size grows steadily with iteration.
* The average clustering coefficient decreases rapidly initially and then plateaus.
* The growth in edges is faster than the growth in nodes, suggesting increasing network density.
### Interpretation
The data suggests a network undergoing a growth process. The consistent increase in nodes and edges indicates network expansion. The initial decrease in average clustering, followed by stabilization, is a common phenomenon in growing networks, particularly those formed through preferential attachment or similar mechanisms. As the network grows, it becomes more difficult to form triangles (which contribute to clustering), leading to a decrease in the clustering coefficient. The increasing maximum degree suggests the emergence of hub nodes within the network. The faster growth of edges compared to nodes indicates that the network is becoming denser over time. The plateauing of the average clustering coefficient suggests that the network is reaching a state where the addition of new edges does not significantly alter the overall clustering structure. The data provides insights into the dynamic evolution of a complex network, potentially representing social networks, biological networks, or technological networks.