\n
## Multi-Panel Line Chart: Network Evolution Metrics
### Overview
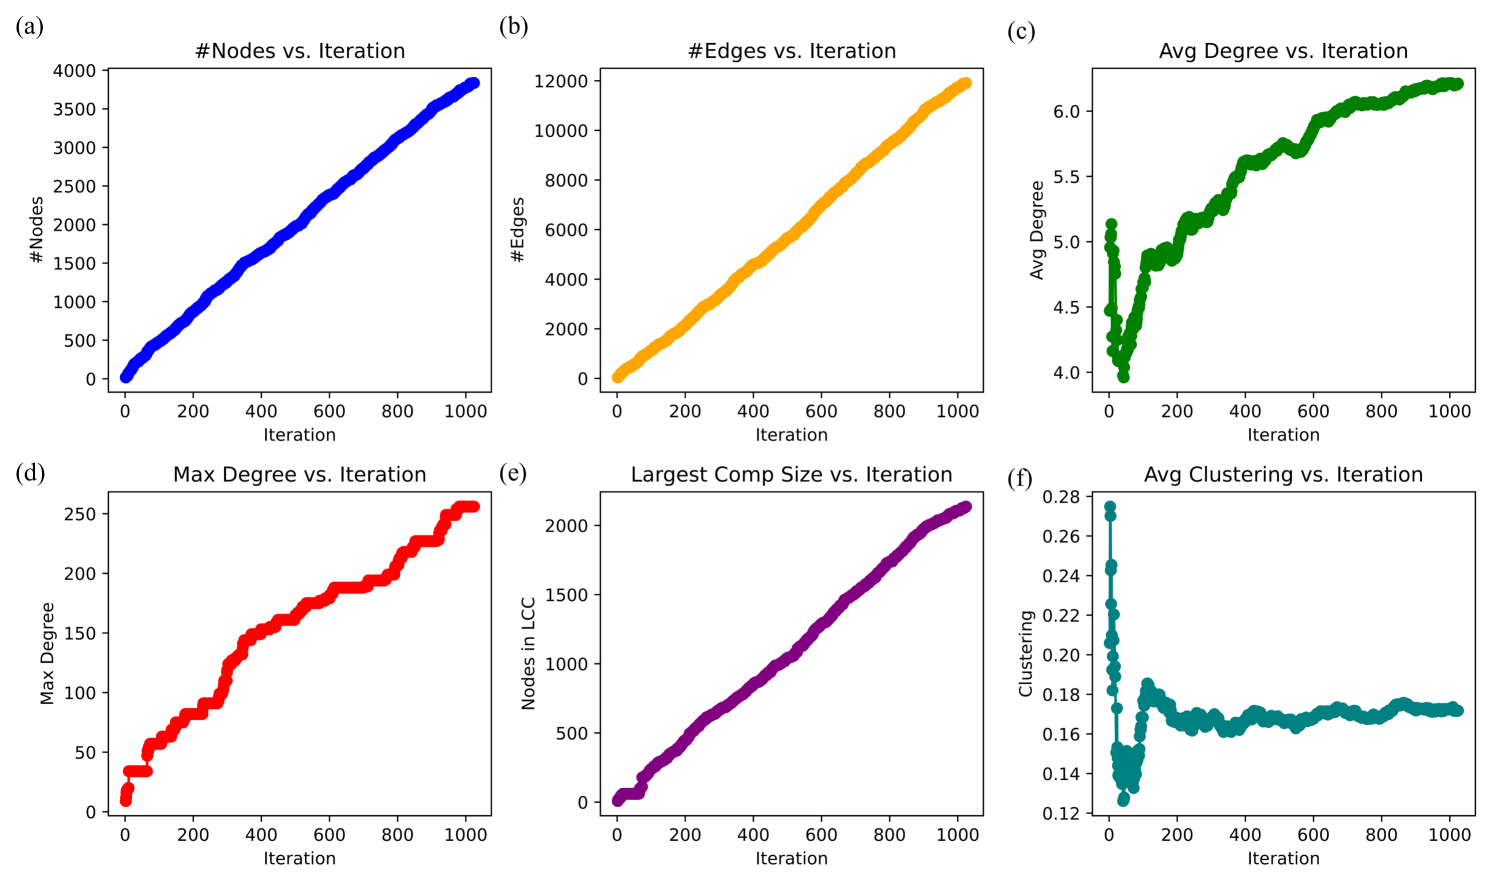
The image is a composite figure containing six individual line charts, labeled (a) through (f), arranged in a 2x3 grid. Each chart plots a different network metric against a common x-axis, "Iteration," which ranges from 0 to 1000. The charts collectively visualize the evolution of various properties of a network (likely a growing graph) over time or steps. The data is presented as dense scatter plots with connected points, forming thick lines.
### Components/Axes
* **Common X-Axis (All Charts):** Label: "Iteration". Scale: Linear, from 0 to 1000 with major tick marks at 0, 200, 400, 600, 800, 1000.
* **Subplot (a) - Top Left:**
* **Title:** "#Nodes vs. Iteration"
* **Y-Axis Label:** "#Nodes"
* **Y-Axis Scale:** Linear, from 0 to 4000 with major ticks every 500.
* **Data Series Color:** Blue.
* **Subplot (b) - Top Center:**
* **Title:** "#Edges vs. Iteration"
* **Y-Axis Label:** "#Edges"
* **Y-Axis Scale:** Linear, from 0 to 12000 with major ticks every 2000.
* **Data Series Color:** Orange.
* **Subplot (c) - Top Right:**
* **Title:** "Avg Degree vs. Iteration"
* **Y-Axis Label:** "Avg Degree"
* **Y-Axis Scale:** Linear, from 4.0 to 6.0 with major ticks every 0.5.
* **Data Series Color:** Green.
* **Subplot (d) - Bottom Left:**
* **Title:** "Max Degree vs. Iteration"
* **Y-Axis Label:** "Max Degree"
* **Y-Axis Scale:** Linear, from 0 to 250 with major ticks every 50.
* **Data Series Color:** Red.
* **Subplot (e) - Bottom Center:**
* **Title:** "Largest Comp Size vs. Iteration"
* **Y-Axis Label:** "Nodes in LCC" (LCC likely stands for Largest Connected Component).
* **Y-Axis Scale:** Linear, from 0 to 2000 with major ticks every 500.
* **Data Series Color:** Purple.
* **Subplot (f) - Bottom Right:**
* **Title:** "Avg Clustering vs. Iteration"
* **Y-Axis Label:** "Clustering"
* **Y-Axis Scale:** Linear, from 0.12 to 0.28 with major ticks every 0.02.
* **Data Series Color:** Teal.
### Detailed Analysis
* **Trend Verification & Data Points:**
* **(a) #Nodes:** The blue line shows a strong, nearly perfect linear upward trend. Starting near 0 at iteration 0, it reaches approximately 3800 nodes by iteration 1000.
* **(b) #Edges:** The orange line also shows a strong, nearly perfect linear upward trend, steeper than the node count. Starting near 0, it reaches approximately 12,000 edges by iteration 1000.
* **(c) Avg Degree:** The green line shows an initial sharp drop from ~5.1 to ~4.0 within the first ~50 iterations, followed by a general upward trend with some fluctuations. It rises to approximately 6.2 by iteration 1000.
* **(d) Max Degree:** The red line shows a stepwise, generally increasing trend. It starts near 0, has a notable jump around iteration 300-400, and ends at approximately 255 by iteration 1000.
* **(e) Largest Comp Size (Nodes in LCC):** The purple line shows a strong, nearly perfect linear upward trend, very similar in shape to the #Nodes plot. It starts near 0 and reaches approximately 2100 nodes in the LCC by iteration 1000.
* **(f) Avg Clustering:** The teal line shows a dramatic initial drop from ~0.275 to a minimum of ~0.125 within the first ~50 iterations. It then recovers to a plateau around 0.17-0.18, where it remains relatively stable with minor fluctuations for the remainder of the iterations.
### Key Observations
1. **Linear Growth:** The total number of nodes, edges, and the size of the largest connected component all grow linearly with iteration. This suggests a consistent, rule-based network growth process.
2. **Degree Dynamics:** While the average degree dips initially, it recovers and increases over time, indicating the network becomes more densely connected on average as it grows. The maximum degree increases in a stepwise fashion, suggesting the emergence of occasional "hub" nodes.
3. **Clustering Collapse and Stabilization:** The average clustering coefficient undergoes a severe collapse early in the process, indicating a rapid loss of local triadic closure. It then stabilizes at a lower value (~0.17), suggesting the growing network maintains a consistent, albeit low, level of local clustering after the initial phase.
4. **LCC vs. Total Nodes:** The size of the largest connected component (LCC) tracks very closely with the total number of nodes (compare plots a and e). By iteration 1000, the LCC contains ~2100 of the ~3800 total nodes (~55%), indicating the network is not fully connected but has a single dominant component.
### Interpretation
The data depicts the evolution of a growing network under a specific generative model. The linear growth in nodes and edges points to a process where a fixed number of nodes and connections are added per iteration. The early, sharp decline in both average degree and clustering is a critical signature. This pattern is characteristic of models where new nodes initially attach in a way that does not form many triangles (low clustering) and may connect to a limited number of existing nodes (lowering average degree). The subsequent rise in average degree suggests the attachment rules may change or that later nodes connect more broadly. The stabilization of clustering at a low, non-zero value indicates the model produces a network with some, but not excessive, local cohesiveness. The close tracking of the LCC size with total nodes implies the growth process efficiently integrates most new nodes into the main component. Overall, this figure likely analyzes a simulation of a network growth algorithm, highlighting its impact on fundamental topological properties over time.