## Line Graphs: Network Metrics vs. Iteration
### Overview
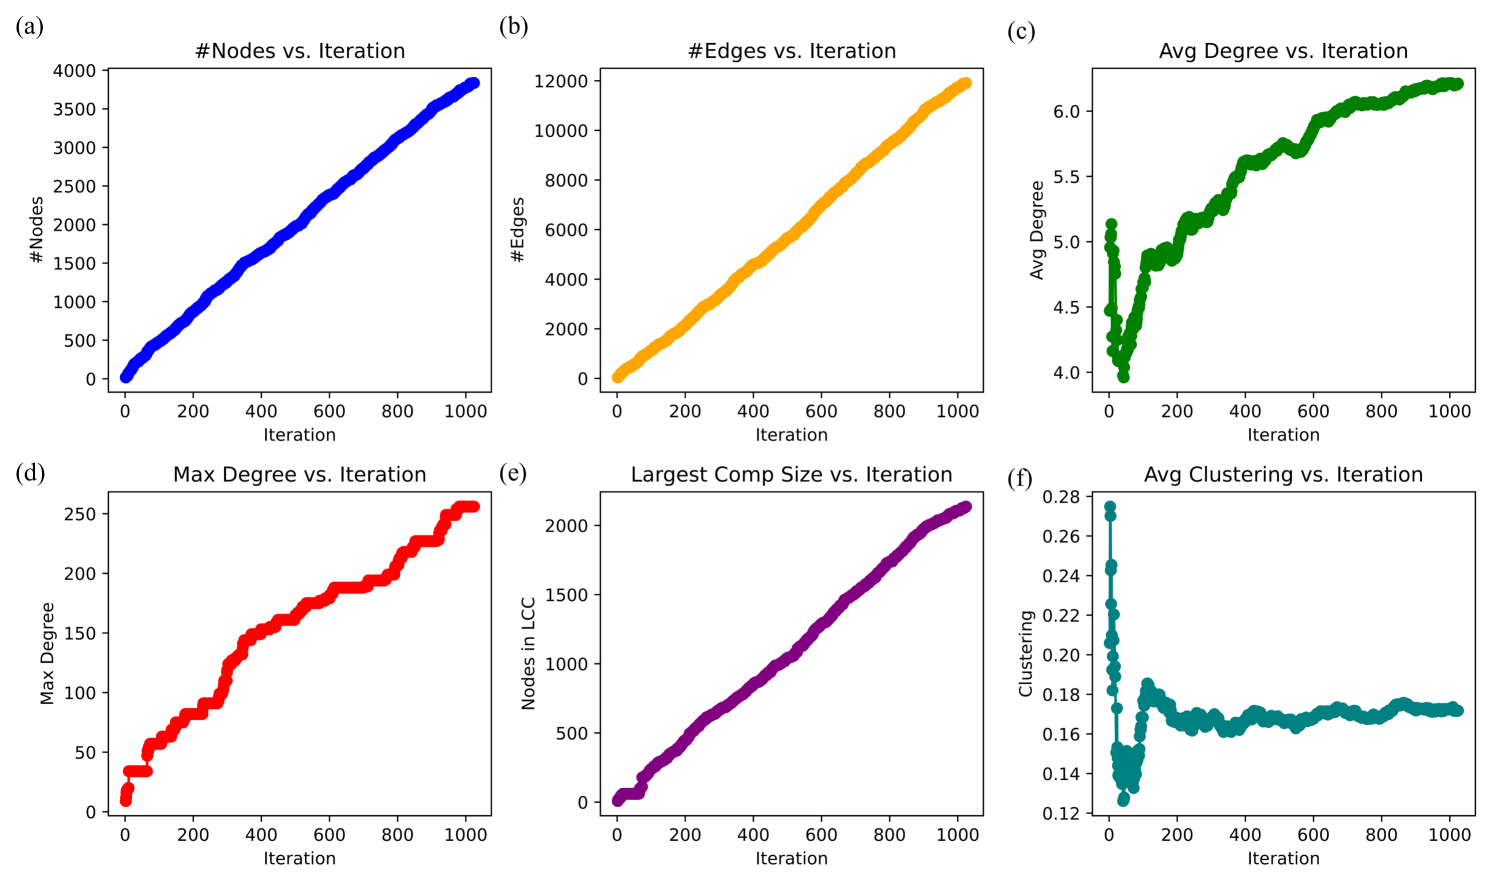
The image contains six subplots (a-f) depicting the evolution of network properties over 1000 iterations. Each subplot tracks a distinct metric: node count, edge count, average degree, maximum degree, largest connected component size, and average clustering coefficient. All plots show time-series data with iteration on the x-axis and metric values on the y-axis.
### Components/Axes
- **Subplot (a)**:
- **Title**: "#Nodes vs. Iteration"
- **X-axis**: Iteration (0–1000)
- **Y-axis**: #Nodes (0–4000)
- **Legend**: Top-left (blue line labeled "Nodes")
- **Subplot (b)**:
- **Title**: "#Edges vs. Iteration"
- **X-axis**: Iteration (0–1000)
- **Y-axis**: #Edges (0–12000)
- **Legend**: Top-left (orange line labeled "Edges")
- **Subplot (c)**:
- **Title**: "Avg Degree vs. Iteration"
- **X-axis**: Iteration (0–1000)
- **Y-axis**: Avg Degree (4.0–6.0)
- **Legend**: Top-left (green line labeled "Avg Degree")
- **Subplot (d)**:
- **Title**: "Max Degree vs. Iteration"
- **X-axis**: Iteration (0–1000)
- **Y-axis**: Max Degree (0–250)
- **Legend**: Top-left (red line labeled "Max Degree")
- **Subplot (e)**:
- **Title**: "Largest Comp Size vs. Iteration"
- **X-axis**: Iteration (0–1000)
- **Y-axis**: Nodes in LCC (0–2000)
- **Legend**: Top-left (purple line labeled "Largest Comp Size")
- **Subplot (f)**:
- **Title**: "Avg Clustering vs. Iteration"
- **X-axis**: Iteration (0–1000)
- **Y-axis**: Clustering (0.12–0.28)
- **Legend**: Top-left (teal line labeled "Clustering")
### Detailed Analysis
#### Subplot (a): #Nodes vs. Iteration
- **Trend**: Linear increase from ~0 nodes at iteration 0 to ~3800 nodes at iteration 1000.
- **Key Points**:
- Iteration 200: ~1000 nodes
- Iteration 500: ~2500 nodes
- Iteration 800: ~3300 nodes
#### Subplot (b): #Edges vs. Iteration
- **Trend**: Linear increase from ~0 edges at iteration 0 to ~11800 edges at iteration 1000.
- **Key Points**:
- Iteration 200: ~2000 edges
- Iteration 500: ~5500 edges
- Iteration 800: ~9500 edges
#### Subplot (c): Avg Degree vs. Iteration
- **Trend**: Initial dip from ~4.5 to ~4.0 (iterations 0–100), then steady rise to ~6.0 by iteration 1000.
- **Key Points**:
- Iteration 100: ~4.0
- Iteration 300: ~5.0
- Iteration 600: ~5.8
#### Subplot (d): Max Degree vs. Iteration
- **Trend**: Sharp initial spike to ~50 (iteration 100), followed by gradual increase to ~250 at iteration 1000.
- **Key Points**:
- Iteration 100: ~50
- Iteration 400: ~150
- Iteration 700: ~200
#### Subplot (e): Largest Comp Size vs. Iteration
- **Trend**: Linear increase from ~0 nodes at iteration 0 to ~2000 nodes at iteration 1000.
- **Key Points**:
- Iteration 200: ~500 nodes
- Iteration 500: ~1000 nodes
- Iteration 800: ~1700 nodes
#### Subplot (f): Avg Clustering vs. Iteration
- **Trend**: Sharp drop from ~0.28 to ~0.14 (iterations 0–100), then stabilization between ~0.16–0.18.
- **Key Points**:
- Iteration 0: ~0.28
- Iteration 100: ~0.14
- Iteration 500: ~0.17
### Key Observations
1. **Network Growth**: Nodes, edges, and largest connected component size all increase linearly, suggesting a scalable network expansion.
2. **Degree Dynamics**:
- Average degree rises steadily, indicating increasing connectivity.
- Max degree spikes early, implying the emergence of a hub node.
3. **Clustering Collapse**: The clustering coefficient drops sharply initially, then stabilizes, suggesting the network becomes less cohesive as it grows.
### Interpretation
The data demonstrates a network evolving from a sparse, fragmented structure to a densely connected system. The early drop in clustering (subplot f) aligns with the emergence of the hub node (subplot d), which likely disrupts local connectivity. The linear growth of nodes and edges (subplots a, b) suggests a controlled expansion, while the stabilization of clustering (subplot f) after iteration 100 indicates the network reaches a balance between growth and cohesion. The average degree’s rise (subplot c) reflects the increasing interconnectivity of nodes as the network scales. These trends are critical for understanding the network’s resilience and efficiency in applications like social network analysis or infrastructure modeling.