## State Transition Diagram: Two Possible State Configurations
### Overview
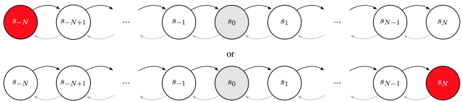
The image presents two possible configurations of a state transition diagram. Each configuration depicts a series of states labeled from s_-N to s_N, represented as circles. The states are connected by arrows indicating possible transitions between adjacent states. The diagram illustrates two scenarios: one where the initial state s_-N is highlighted in red, and another where the final state s_N is highlighted in red. The state s_0 is highlighted in gray in both configurations.
### Components/Axes
* **States:** Represented by circles, labeled as s_-N, s_-N+1, ..., s_-1, s_0, s_1, ..., s_N-1, s_N.
* **Transitions:** Represented by curved arrows connecting adjacent states. There are two arrows between each state, one going to the left and one going to the right. The arrows going to the left are solid black, and the arrows going to the right are light gray.
* **Highlighted States:**
* Red: Indicates the initial or final state in each configuration.
* Gray: Indicates the central state s_0 in both configurations.
* **Text:** The word "or" separates the two configurations.
### Detailed Analysis or ### Content Details
**Top Configuration:**
* **Initial State:** s_-N is highlighted in red.
* **States:** The states are arranged linearly from left to right: s_-N, s_-N+1, ..., s_-1, s_0, s_1, ..., s_N-1, s_N.
* **Transitions:** Each state has a transition to its adjacent states.
* **Central State:** s_0 is highlighted in gray.
**Bottom Configuration:**
* **Final State:** s_N is highlighted in red.
* **States:** The states are arranged linearly from left to right: s_-N, s_-N+1, ..., s_-1, s_0, s_1, ..., s_N-1, s_N.
* **Transitions:** Each state has a transition to its adjacent states.
* **Central State:** s_0 is highlighted in gray.
### Key Observations
* The diagram illustrates two possible states of a system, where either the initial state (s_-N) or the final state (s_N) is active (highlighted in red).
* The central state (s_0) is consistently highlighted in gray in both configurations.
* The transitions between states are bidirectional, allowing movement between adjacent states.
### Interpretation
The diagram represents a system that can exist in a range of states, from s_-N to s_N. The two configurations suggest two possible scenarios: one where the system starts in state s_-N and progresses through the states, and another where the system ends in state s_N. The highlighting of s_0 in both configurations might indicate a central or equilibrium state. The bidirectional transitions suggest that the system can move back and forth between adjacent states. This type of diagram is commonly used to model Markov chains or other state-based systems.