## Diagram: Cyclic Node Sequence with Red and Gray Nodes
### Overview
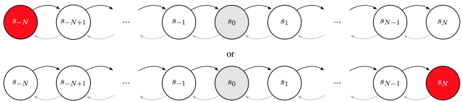
The image depicts two alternative cyclic diagrams composed of interconnected nodes labeled sequentially from `8-N` to `8N`. Both diagrams share identical node labels and directional arrows but differ in the placement of a red-highlighted node. The top diagram highlights the node labeled `8-N` in red, while the bottom diagram highlights the node labeled `8N` in red. A gray-shaded node labeled `80` is centrally positioned in both diagrams.
### Components/Axes
- **Nodes**:
- Labeled sequentially as `8-N`, `8-N+1`, ..., `80`, `81`, ..., `8N-1`, `8N`.
- Total nodes: `N+1` (from `8-N` to `8N`).
- **Arrows**:
- Directed edges form a closed loop, indicating a cyclic flow.
- Arrows connect each node to the next in sequence (e.g., `8-N → 8-N+1 → ... → 8N → 8-N`).
- **Highlighted Nodes**:
- **Red Node**:
- Top diagram: `8-N` (leftmost node).
- Bottom diagram: `8N` (rightmost node).
- **Gray Node**:
- Centrally positioned node labeled `80` in both diagrams.
- **Text**:
- "or" is placed between the two diagrams, suggesting they represent alternative configurations.
### Detailed Analysis
- **Node Sequence**:
- The labels `8-N` to `8N` imply a parameterized range, where `N` defines the sequence length. For example, if `N=5`, the nodes would be labeled `3` (`8-5`), `4` (`8-5+1`), ..., `8`, `9`, ..., `13` (`8+5`).
- The gray node `80` is fixed at the midpoint of the sequence, regardless of `N`.
- **Cyclic Flow**:
- Arrows create a unidirectional loop, ensuring the sequence wraps around from `8N` back to `8-N`.
- **Red Node Placement**:
- Top diagram: Red node at the "start" of the cycle (`8-N`).
- Bottom diagram: Red node at the "end" of the cycle (`8N`).
### Key Observations
1. **Symmetry**: The two diagrams are mirror images in terms of red node placement, with the gray node `80` acting as a central anchor.
2. **Parameter Dependency**: The sequence length (`N+1` nodes) and the fixed midpoint (`80`) suggest the diagrams model a system where `N` scales the range while maintaining a reference point.
3. **Red Node Significance**: The red node likely denotes a critical state (e.g., initialization, termination, or anomaly) depending on its position.
### Interpretation
- **Cyclic System Behavior**: The diagrams likely represent a cyclic process (e.g., data pipeline, state machine) where the red node marks a pivotal event. The top diagram emphasizes the "origin" of the cycle, while the bottom diagram highlights the "closure."
- **Gray Node Role**: The gray node `80` may represent a stable or reference state within the cycle, unaffected by variations in `N`.
- **Alternative Configurations**: The "or" implies the system can operate in two modes: one prioritizing the initial state (`8-N`) and the other the terminal state (`8N`).
No numerical data or trends are present; the focus is on structural relationships and symbolic labeling.