## Diagram and Chart: 4-Token Prediction Model and Performance
### Overview
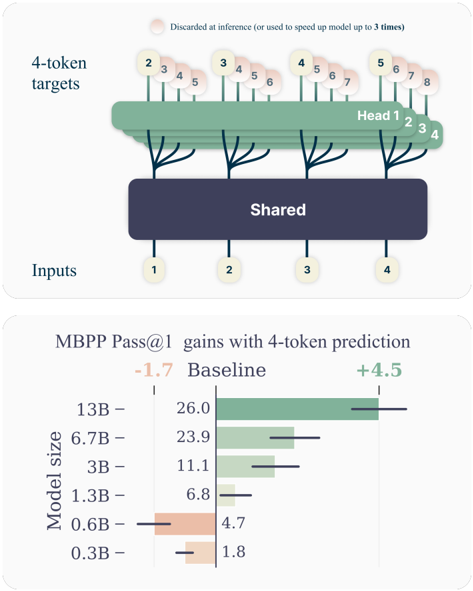
The image presents a two-part visualization. The top portion is a diagram illustrating a 4-token prediction model architecture, showing inputs, a shared layer, heads, and targets. The bottom portion is a horizontal bar chart displaying the MBPP Pass@1 gains achieved with 4-token prediction for various model sizes, relative to a baseline.
### Components/Axes
**Top Diagram:**
* **Title:** None explicitly stated, but the diagram illustrates a "4-token prediction" model.
* **Elements:**
* **Inputs:** Labeled "Inputs" on the bottom-left. Four input nodes are numbered 1 through 4.
* **Shared Layer:** A dark blue-purple rectangular block labeled "Shared."
* **Heads:** A green block labeled "Head 1 2 3 4".
* **4-token targets:** Labeled "4-token targets" on the top-left. Each target has a stack of numbers, representing tokens.
* **Discarded at inference:** A light pink circle with the text "Discarded at inference (or used to speed up model up to 3 times)" in the top-right.
**Bottom Chart:**
* **Title:** "MBPP Pass@1 gains with 4-token prediction"
* **Y-axis:** "Model size" with labels: 13B, 6.7B, 3B, 1.3B, 0.6B, 0.3B.
* **X-axis:** Implicitly represents the "MBPP Pass@1 gains". The baseline is marked with "-1.7" and "+4.5".
* **Data Series:** Horizontal bars representing the gains for each model size. Error bars are also present.
### Detailed Analysis
**Top Diagram:**
* The diagram shows four inputs feeding into a shared layer. The shared layer then connects to four heads. Each head predicts a sequence of tokens (4-token targets). Some tokens are marked as "Discarded at inference".
**Bottom Chart:**
* **Model Sizes and Gains:**
* **13B:** Green bar, gain of approximately 26.0.
* **6.7B:** Green bar, gain of approximately 23.9.
* **3B:** Green bar, gain of approximately 11.1.
* **1.3B:** Green bar, gain of approximately 6.8.
* **0.6B:** Orange bar, gain of approximately 4.7.
* **0.3B:** Orange bar, gain of approximately 1.8.
* **Trend:** The MBPP Pass@1 gain generally increases with model size. The 13B model has the highest gain, while the 0.3B model has the lowest.
### Key Observations
* The diagram illustrates a model architecture designed for 4-token prediction.
* The chart shows a positive correlation between model size and MBPP Pass@1 gain when using 4-token prediction.
* The 0.6B and 0.3B models are represented with orange bars, while the larger models are green. This color difference might indicate a performance threshold or a different training regime.
### Interpretation
The data suggests that using a 4-token prediction approach improves the performance (MBPP Pass@1) of models, and this improvement is more pronounced for larger models. The color difference between the smaller (0.6B and 0.3B) and larger models (1.3B to 13B) might indicate a change in the effectiveness of the 4-token prediction strategy or a difference in training methodology for smaller models. The "Discarded at inference" tokens likely represent a technique to optimize inference speed, potentially at the cost of some accuracy.