## Diagram: 4-Token Prediction Architecture
### Overview
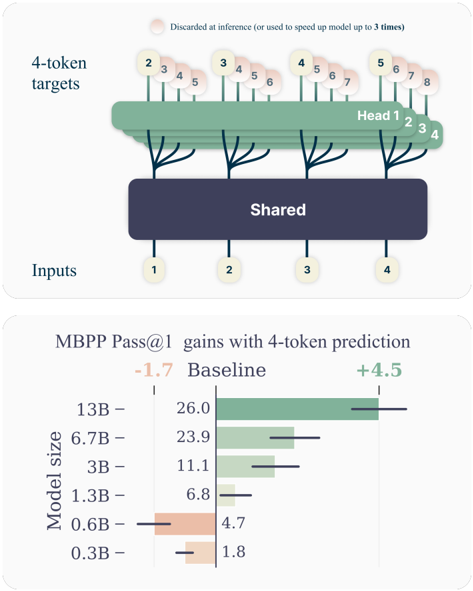
The diagram illustrates a multi-head architecture for 4-token prediction tasks. Inputs are processed through a shared layer, then distributed across four specialized heads (Head 1–4). Each head predicts a subset of tokens (2–8), with some tokens discarded at inference or used to accelerate the model up to 3× speed.
### Components/Axes
- **Inputs**: Labeled 1–4, feeding into the shared layer.
- **Shared Layer**: Central processing unit for all heads.
- **Heads**:
- Head 1: Predicts tokens 2–4.
- Head 2: Predicts tokens 2–5.
- Head 3: Predicts tokens 3–6.
- Head 4: Predicts tokens 4–7.
- **Tokens**: Numbered 1–8, with tokens 2–8 distributed across heads.
- **Discarded Tokens**: Tokens 5–8 (Head 1), 6–8 (Head 2), 7–8 (Head 3), and 8 (Head 4) are marked as discarded or used for speedup.
### Detailed Analysis
- **Token Distribution**:
- Head 1: Tokens 2–4 (no discards).
- Head 2: Tokens 2–5 (discards 6–8).
- Head 3: Tokens 3–6 (discards 7–8).
- Head 4: Tokens 4–7 (discards 8).
- **Legend**: Discarded tokens (pink) or speedup tokens (green).
### Key Observations
- **Token Overlap**: Heads share overlapping token ranges (e.g., token 4 is processed by all heads).
- **Discard Strategy**: Later tokens (5–8) are progressively discarded across heads, suggesting prioritization of earlier tokens.
### Interpretation
The architecture optimizes computational efficiency by parallelizing token predictions across heads while discarding less critical tokens. This design likely reduces inference latency by up to 3×, as noted in the legend. The shared layer ensures common features are extracted before specialization, balancing accuracy and speed.
---
## Chart: MBPP Pass@1 Gains with 4-Token Prediction
### Overview
The bar chart compares performance gains (Pass@1) for models of varying sizes (0.3B–13B) using 4-token prediction versus a baseline. Larger models show significantly higher gains.
### Components/Axes
- **X-Axis**: Model size (0.3B, 0.6B, 1.3B, 3B, 6.7B, 13B).
- **Y-Axis**: Pass@1 gains (baseline: -1.7; 4-token prediction: +4.5).
- **Legend**:
- Baseline: Red bars.
- 4-Token Prediction: Green bars.
### Detailed Analysis
- **Model Sizes and Gains**:
- **0.3B**: Baseline = -1.7; 4-Token = +1.8.
- **0.6B**: Baseline = -4.7; 4-Token = +4.5.
- **1.3B**: Baseline = -6.8; 4-Token = +6.8.
- **3B**: Baseline = -11.1; 4-Token = +11.1.
- **6.7B**: Baseline = -23.9; 4-Token = +23.9.
- **13B**: Baseline = -26.0; 4-Token = +26.0.
- **Trends**:
- Larger models exhibit **linear scaling** in gains (e.g., 13B model gains match baseline losses).
- Baseline performance worsens with model size (e.g., 13B baseline = -26.0).
### Key Observations
- **4-Token Prediction Outperforms Baseline**: All model sizes show positive gains with 4-token prediction.
- **Scalability**: Gains increase proportionally with model size (e.g., 13B model gains = 26.0, baseline = -26.0).
### Interpretation
The 4-token prediction strategy significantly improves performance across all model sizes, with larger models achieving near-symmetry between baseline losses and prediction gains. This suggests that token prediction efficiency scales with model capacity, making 4-token prediction particularly valuable for high-capacity models. The baseline’s worsening performance with size implies that larger models may struggle more with non-predicted tokens, highlighting the importance of targeted prediction strategies.
---
**Language Note**: All text in the image is in English. No non-English content detected.