# Technical Document Extraction: Constrained BFS-tree Diagram
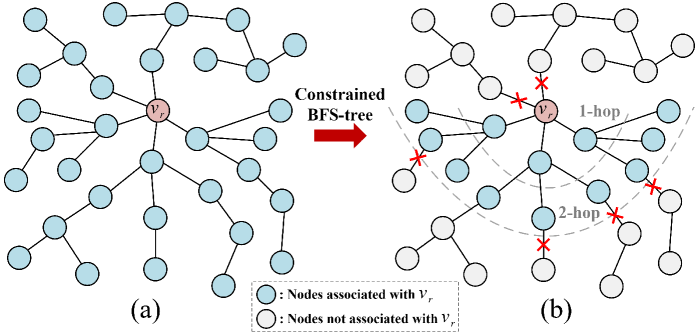
This image illustrates the process of generating a **Constrained BFS-tree** (Breadth-First Search tree) from a general graph structure. The diagram is divided into two main stages, labeled (a) and (b), connected by a process indicator.
## 1. Component Isolation
### Region 1: Initial Graph (a)
* **Location:** Left side of the image.
* **Description:** A graph consisting of a central root node and multiple branching paths.
* **Root Node:** Labeled $v_r$, colored in a light reddish-brown/pink.
* **Peripheral Nodes:** All other nodes are colored light blue.
* **Structure:** Every node in this panel is colored blue, indicating they are all currently associated with the root $v_r$.
### Region 2: Transition Process
* **Location:** Center, between (a) and (b).
* **Text Label:** "Constrained BFS-tree"
* **Visual Element:** A thick red arrow pointing from left to right, indicating a transformation or filtering process.
### Region 3: Constrained Graph (b)
* **Location:** Right side of the image.
* **Description:** The same graph structure as (a), but with specific constraints applied to node association.
* **Root Node:** Labeled $v_r$, colored light reddish-brown/pink.
* **Node States:** Nodes are now differentiated into two colors: light blue and light grey.
* **Spatial Markers:**
* **1-hop:** A dashed grey arc indicating the first level of neighbors from the root.
* **2-hop:** A dashed grey arc indicating the second level of neighbors from the root.
* **Constraint Markers:** Red "X" marks are placed on specific edges. These marks indicate where the "association" with $v_r$ is severed or blocked.
### Region 4: Legend
* **Location:** Bottom center.
* **Symbol 1:** Light blue circle: "Nodes associated with $V_r$"
* **Symbol 2:** Light grey circle: "Nodes not associated with $V_r$"
---
## 2. Data and Flow Analysis
### Process Flow
The diagram demonstrates how a global graph (a) is pruned into a constrained tree (b). The constraints appear to be based on both distance (hops) and specific edge-level restrictions (the red X marks).
### Trend and Logic Verification
1. **Distance Constraint:** In panel (b), nodes within the "1-hop" and "2-hop" radius are generally blue (associated), while nodes beyond the 2-hop radius transition to grey (not associated).
2. **Edge Constraint:** Even within the hop boundaries, if an edge is marked with a **red X**, the downstream nodes (and the node immediately following the X) turn grey.
* *Example:* In the top-left quadrant of (b), a red X appears on the edge directly connected to $v_r$. Consequently, that entire branch is grey.
* *Example:* In the bottom-right quadrant, a red X appears after the 2-hop boundary, turning the subsequent nodes grey.
### Node Association Summary
| Node Color | Status | Condition in (b) |
| :--- | :--- | :--- |
| **Light Blue** | Associated with $v_r$ | Within hop limits AND no red X on the path from $v_r$. |
| **Light Grey** | Not associated with $v_r$ | Outside hop limits OR path is blocked by a red X. |
---
## 3. Textual Transcription
* **Labels:**
* `(a)`: Identifier for the initial state.
* `(b)`: Identifier for the constrained state.
* $v_r$: The root node identifier (appears in both graphs).
* `Constrained BFS-tree`: The name of the process/result.
* `1-hop`: Distance marker for the first neighbor level.
* `2-hop`: Distance marker for the second neighbor level.
* **Legend Text:**
* `Nodes associated with V_r` (Note: The legend uses capital $V_r$ while the nodes use lowercase $v_r$).
* `Nodes not associated with V_r`.