## Diagram: Decision and Process Flow Schematics
### Overview
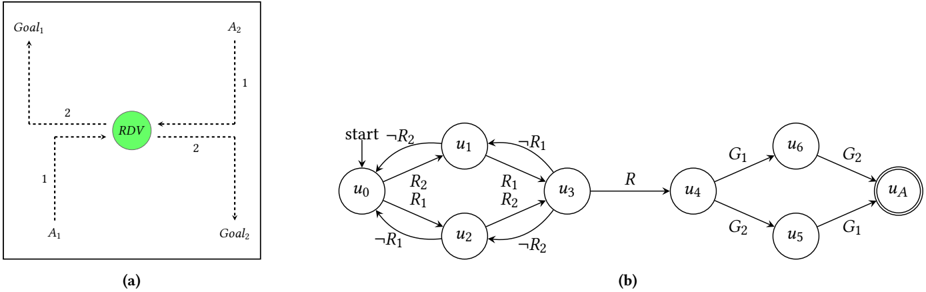
The image contains two distinct diagrams:
- **(a)** A decision tree with a central node labeled "RDV" connected to goals (Goal1, Goal2) and actions (A1, A2) via labeled arrows.
- **(b)** A state transition diagram with nodes (u0–u6, uA) and transitions marked by labels like R1, R2, G1, G2, and R.
### Components/Axes
#### Diagram (a):
- **Central Node**: "RDV" (green circle, center of the square).
- **Arrows**:
- From RDV to **Goal1** (upward, labeled "1").
- From RDV to **Goal2** (downward, labeled "2").
- From RDV to **A1** (leftward, labeled "1").
- From RDV to **A2** (rightward, labeled "2").
- **Layout**: Dotted lines form a square around the central node.
#### Diagram (b):
- **Nodes**:
- **Start**: u0 (labeled "start").
- **Intermediate**: u1, u2, u3, u4, u5, u6.
- **Final**: uA (double-circle node).
- **Transitions**:
- **R1/R2**: Bidirectional arrows between u0, u1, u2, u3.
- **R**: Unidirectional arrow from u3 to u4.
- **G1/G2**: Arrows from u4 to u5/u6 and from u5/u6 to uA.
- **Labels**:
- "start" (arrow from u0).
- "R", "G1", "G2" (transition labels).
### Detailed Analysis
#### Diagram (a):
- **Labels**:
- Goals: Goal1, Goal2.
- Actions: A1, A2.
- Central node: RDV.
- Arrow labels: "1" (Goal1, A1), "2" (Goal2, A2).
- **Flow**: RDV is the decision point, with paths to goals and actions. The numbers on arrows may indicate priority, frequency, or step count.
#### Diagram (b):
- **Labels**:
- Nodes: u0 (start), u1–u6, uA.
- Transitions: R1, R2 (bidirectional), R (unidirectional), G1, G2 (unidirectional).
- **Flow**:
- Start at u0 → branches to u1 (R1) and u2 (R2).
- u1 and u2 converge to u3 → u4 (R).
- u4 branches to u5 (G2) and u6 (G1).
- u5 and u6 converge to uA.
- Direct path from u4 to uA via R.
### Key Observations
- **Diagram (a)**:
- Symmetrical layout with RDV as the focal point.
- Arrows to goals and actions suggest a trade-off or decision between objectives and actions.
- Numbers "1" and "2" may imply hierarchical or quantitative relationships (e.g., priority, cost, or steps).
- **Diagram (b)**:
- State transitions involve feedback loops (e.g., R1/R2 between u0, u1, u2).
- G1/G2 transitions suggest group-specific pathways to the final state uA.
- The direct R transition from u4 to uA implies a shortcut or alternative route.
### Interpretation
- **Diagram (a)**:
- RDV likely represents a decision variable or resource allocation point.
- Goals (Goal1/Goal2) and actions (A1/A2) may reflect competing priorities or outcomes.
- The numbers on arrows could indicate resource allocation (e.g., 1 unit to Goal1, 2 units to Goal2).
- **Diagram (b)**:
- The flowchart models a system with multiple states and transitions, possibly representing a process with feedback (e.g., R1/R2 loops) and group-specific outcomes (G1/G2).
- The direct R transition from u4 to uA suggests a critical path or emergency route.
- The use of "start" and "uA" implies a defined beginning and end state, typical of workflow or algorithmic processes.
- **Cross-Diagram Relationships**:
- Both diagrams use labeled nodes and transitions, suggesting they model decision-making or process flows.
- RDV in (a) could correspond to a state in (b) (e.g., u4), with goals/actions mapping to transitions (e.g., G1/G2).
### Notes on Data and Structure
- No numerical data beyond arrow labels (1, 2) or node labels (u0–u6, uA).
- No explicit legend or color coding; diagrams rely on labels and spatial arrangement.
- Spatial grounding:
- Diagram (a): Central node (RDV) is at the center of the square.
- Diagram (b): Nodes are arranged in a left-to-right, top-to-bottom sequence with branching.
### Conclusion
The diagrams illustrate decision-making (a) and process flow (b) with explicit labels for nodes, transitions, and goals. While no numerical data is provided beyond labels, the structure suggests a focus on relationships, priorities, and state transitions. Further context (e.g., definitions of R1/R2, G1/G2) would clarify their meanings.