## Diagram: RDV Path and State Transition Diagram
### Overview
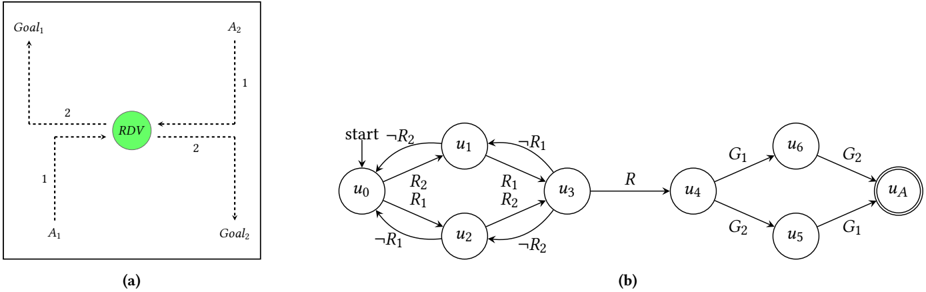
The image presents two diagrams. Diagram (a) illustrates a path for an entity labeled "RDV" to reach different goals (Goal1, Goal2) and locations (A1, A2). Diagram (b) depicts a state transition diagram with states labeled u0 through u6 and uA, connected by transitions labeled with R, R1, R2, G1, G2, and their negations.
### Components/Axes
**Diagram (a): RDV Path**
* **Nodes:**
* RDV (a green circle in the center)
* Goal1 (top-left)
* Goal2 (bottom-right)
* A1 (bottom-left)
* A2 (top-right)
* **Paths:** Dotted lines indicating possible routes.
* **Labels:** Numerical labels (1, 2) indicating path weights or costs.
**Diagram (b): State Transition Diagram**
* **Nodes:** States labeled u0, u1, u2, u3, u4, u5, u6, and uA (where uA is a double-circled final state).
* **Edges:** Arrows indicating transitions between states.
* **Labels:** Transition labels R, R1, R2, G1, G2, -R1, -R2.
* **Start:** An arrow pointing to state u0 labeled "start".
### Detailed Analysis
**Diagram (a): RDV Path**
* From RDV:
* To Goal1: A dotted line goes up, then left, labeled "2" then "1".
* To Goal2: A dotted line goes down, then right, labeled "2" then "1".
* To A1: A dotted line goes left, then down, labeled "2" then "1".
* To A2: A dotted line goes right, then up, labeled "2" then "1".
**Diagram (b): State Transition Diagram**
* **State u0:**
* "start" arrow points to u0.
* Transition to u1 labeled "-R2".
* Transition to u2 labeled "R2, R1".
* Loop back to u0 labeled "-R1".
* **State u1:**
* Transition to u3 labeled "-R1".
* **State u2:**
* Transition to u3 labeled "-R2".
* **State u3:**
* Transition to u1 labeled "R1, R2".
* Transition to u2 labeled "R1, R2".
* Transition to u4 labeled "R".
* **State u4:**
* Transition to u6 labeled "G1".
* Transition to u5 labeled "G2".
* **State u5:**
* Transition to uA labeled "G1".
* **State u6:**
* Transition to uA labeled "G2".
* **State uA:**
* Final state (double circle).
### Key Observations
* Diagram (a) shows a symmetrical path structure centered around the RDV.
* Diagram (b) shows a more complex state transition diagram with loops and branching paths.
* State uA is the only final state in diagram (b).
### Interpretation
* Diagram (a) likely represents a simplified environment where the RDV can navigate to different locations with associated costs. The symmetry suggests that the cost to reach each goal or location is the same.
* Diagram (b) represents a finite state machine. The labels on the transitions likely represent conditions or actions that cause the system to move from one state to another. The final state uA represents a successful completion of some process. The initial states u0, u1, u2, u3 form a cycle, suggesting a repeating or iterative process. The transitions from u4 to u5/u6 and then to uA suggest a branching decision process leading to the final state.